Hi, I’m Christian and this is a newsletter with interesting content and links orbiting the world of graph.
The newsletter is out a day late this week as I was attending the virtual Knowledge Graph Conference and wanted to draw from the whole event. A warm welcome ( 👋 ) to all those who found source/target through the conference. I hope you like the newsletter, you can check out the archive here to see all the previous editions.
Don’t forget you can respond directly to this email if you have any feedback or suggestions—I’d love to hear from you.
Graphs
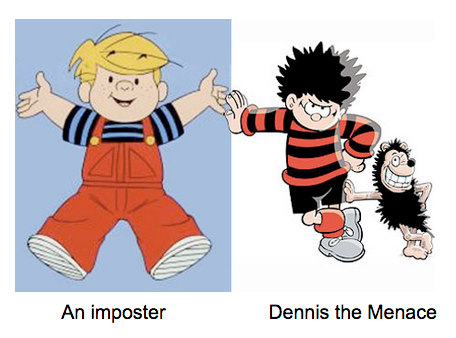
As a teenager I was an avid reader of two magazines that I’d buy from the newsagent in my town: the Beano and Computeract!ve.
For those who aren’t familiar, the Beano was the home of the famous comic book character Dennis the Menace. I bet you’re picturing Dennis right now. Frankly, most of you will be way off. Some argue that the American version of Dennis the Menace was the original as the character was conceived 5 days before the British version. Of course these people are just plain wrong.
Anyway, I digress. Computeract!ve —the other magazine I’d buy—appealed to my young, computer-obsessed mind. It covered the confluence of two very exciting new developments: computer software and the internet. Check out these retro covers to get a flavour of the contents:
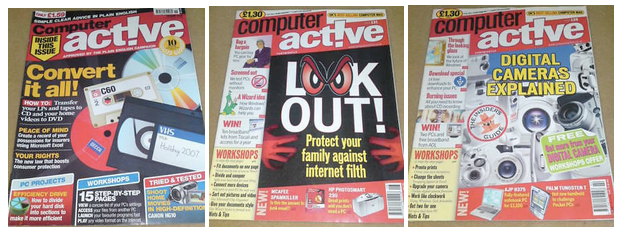
The magazine proudly noted a recommendation from the “Plain English Campaign”, a group that promotes the use of simple, easy-to-understand language in all content. I used to think this was some sort of ultimate badge of honor for publications but looking into it now it’s a curious little group.
In the past few years I’ve come to recognize writing as an important skill worth practicing and honing, especially when you’re looking for maximum clarity. It’s especially important in the technology domain as it’s easy to “over-write” or rely on jargon and domain-specific language. If you’re interested in writing, I recommend the classic Zinsser book “On Writing Well.” It helped me understand that words that don’t contribute to the overall message can often be removed from technical writing.
As regular readers will know, my background is primarily in graph theory and industry applications of graph analytics and visualization. My go-to graph database uses a model commonly known as a Property Graph: a deceptively simple, intuitive model for building and reasoning with connected data.
I wasn’t quite sure what to expect from the Knowledge Graph Conference. I’ve had some exposure to “Knowledge Graphs” before but my understanding of them paled in comparison to Property Graphs I work with day-to-day. My aim was to gain a greater understanding of the delineation between the two.
My first takeaway was that I’d naively walked into a hot topic that has been discussed at length for decades.
But first of all congratulations to the conference organizers; it’s heartening to see a conference move to virtual in a way that didn’t prevent the sharing of interesting ideas and opinions.
What is a Knowledge Graph?
Wading into the world of “Knowledge Graphs”, it’s easy to get lost in a world of jargon. In fact, one might expect a stern phone call from the Plain English Campaign. This is entirely as expected; the field skews academic since knowledge graphs and the direct ancestor “semantics” interleave with logic, knowledge science, philosophy and mathematics. To a lowly graph practitioner such as myself it can be quite hard to get a handle on the field.
As core community member & Principal Scientist Juan Sequeda noted in a blog post from 2018:
“… we don’t want people searching for “Knowledge Graphs” and finding a bunch of papers, problems, etc instead of real world solutions (this is what happened with Semantic Web).”
The same goes for terminology: here’s just a small flavor of the words and acronyms you’ll find when doing a cursory exploration of the space. How many do you think you could define on the spot?
Ontology, Taxonomy, Reasoning, RDF, Triple Stores, Inference, SPARQL, Semantics, Predicates
In her talk, Melliyal Annamalai (Oracle) noted that
“Knowledge Graph Conferences typically attract 100s not 1000s”. Could this reflect the accessibility of the field, or rather the restriction imposed by the terse disagreements over definitions?
The work being done in the world of knowledge graphs is interesting and important, yet it is my understanding (as hinted in the quote from Sequeda above) that discussion and tooling around the Semantic Web has impeded growth and accessibility of the field. As Ying Ding (University of Texas, Austin) mentioned in her talk on drug discovery techniques:
"people say you need a PhD to write SPARQL queries.”
Let’s return to the pervasive question: what exactly is a knowledge graph? I’m not going to take a stab at providing a definition here, as tempting as it may be. The “holy grail” definition to solve all disagreements and answer all questions isn’t likely to exist. Instead I’m going to focus on some real-world use-cases discussed at the conference.
Nodes
Here are three personal takeaways from the Knowledge Graph Conference this week.
Not always visual
I often feature smart and innovative graph visualizations in this newsletter. Many of the conference talks reminded me that knowledge graphs in industry typically surface themselves in, frankly, unsexy ways. It’s hard to get people excited about faceted search interfaces, no matter how compelling the design. Nevertheless these systems are fundamental to business users and researchers so—does it matter?
In contrast, this demo from conference sponsor Causality Link demonstrated a clear visual comparison of the relative impact of external factors to various entities in financial markets.
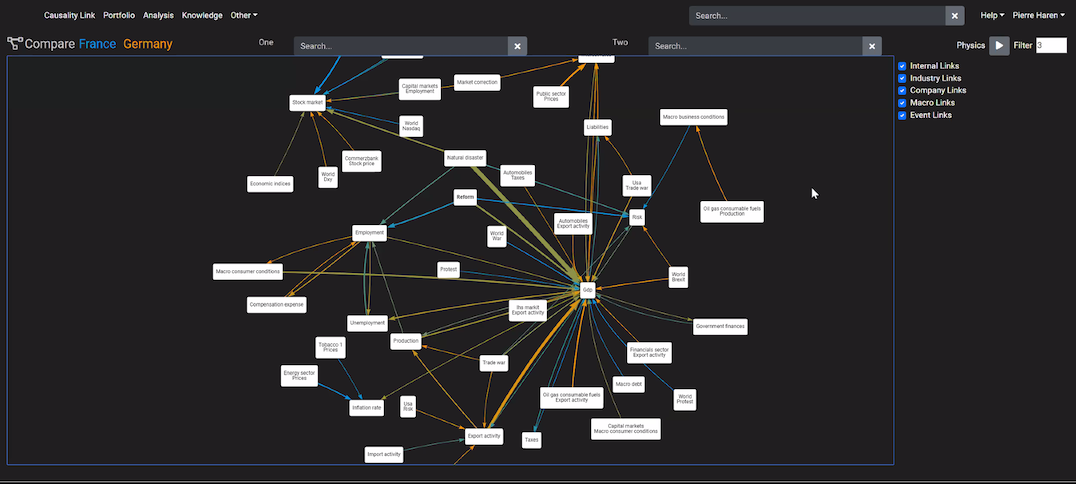
But is this graph just a visual distraction from the excellent, underlying insights generated by the product that could be presented in another, superior way?
Don’t forget about the Crown Jewels
A throwaway comment from Bethany Sehon caught my attention. In her presentation with Brian Donohue she walked through the work of the Enterprise Data Management team at Capital One as they sought to wrangle the data and definitions used by business teams.
I know first hand from working with global enterprise companies that the amount of data produced by employees is overwhelming. Mass profilgation of data silos, personal knowledge bases, stray documentation and disjointed folksonomy make it seemingly impossible to make informed decisions.
Bethany mentioned the importance of looking after the “crown jewels”— those critical pieces of information and knowledge that are buried in the know-how data created and curated by employees. The extensive work undertaken by teams such as Bethany & Brian’s is seen as especially important if you think of it as a way to protect and surface those jewels.
Context is King
I especially enjoyed the talks from individuals working on some of the top RDF graph database companies today. In particular, the talks from Ora Lassila (Amazon Web Services) and Michael Grove (Stardog) stood out. They both took a no-nonsense approach to explaining concepts and core competencies of their respective databases with full coverage of what it means to build “knowledge graphs.”
Near the end of two days of tremendous but concentrated coverage of knowledge graph topics, Grove’s reminder of the fundamental formulation that
“Data + Context = Knowledge”
felt especially helpful. Maybe, at least for me, the definition of “Knowledge” in “Knowledge Graphs” doesn’t have to be more complicated than that? Special Mention goes to use-cases presented by some great speakers: Konstantin Todorov on verifying controversial claims, Huda Khan on the discovery of library resources and Ron Bekkerman on Real Estate Ecosystem graphs. Look out for the release of recordings in the near future.
Link
- It may sound weird at first, but I loved this graph exploration of the ratings given to various Skype backgrounds on TV.
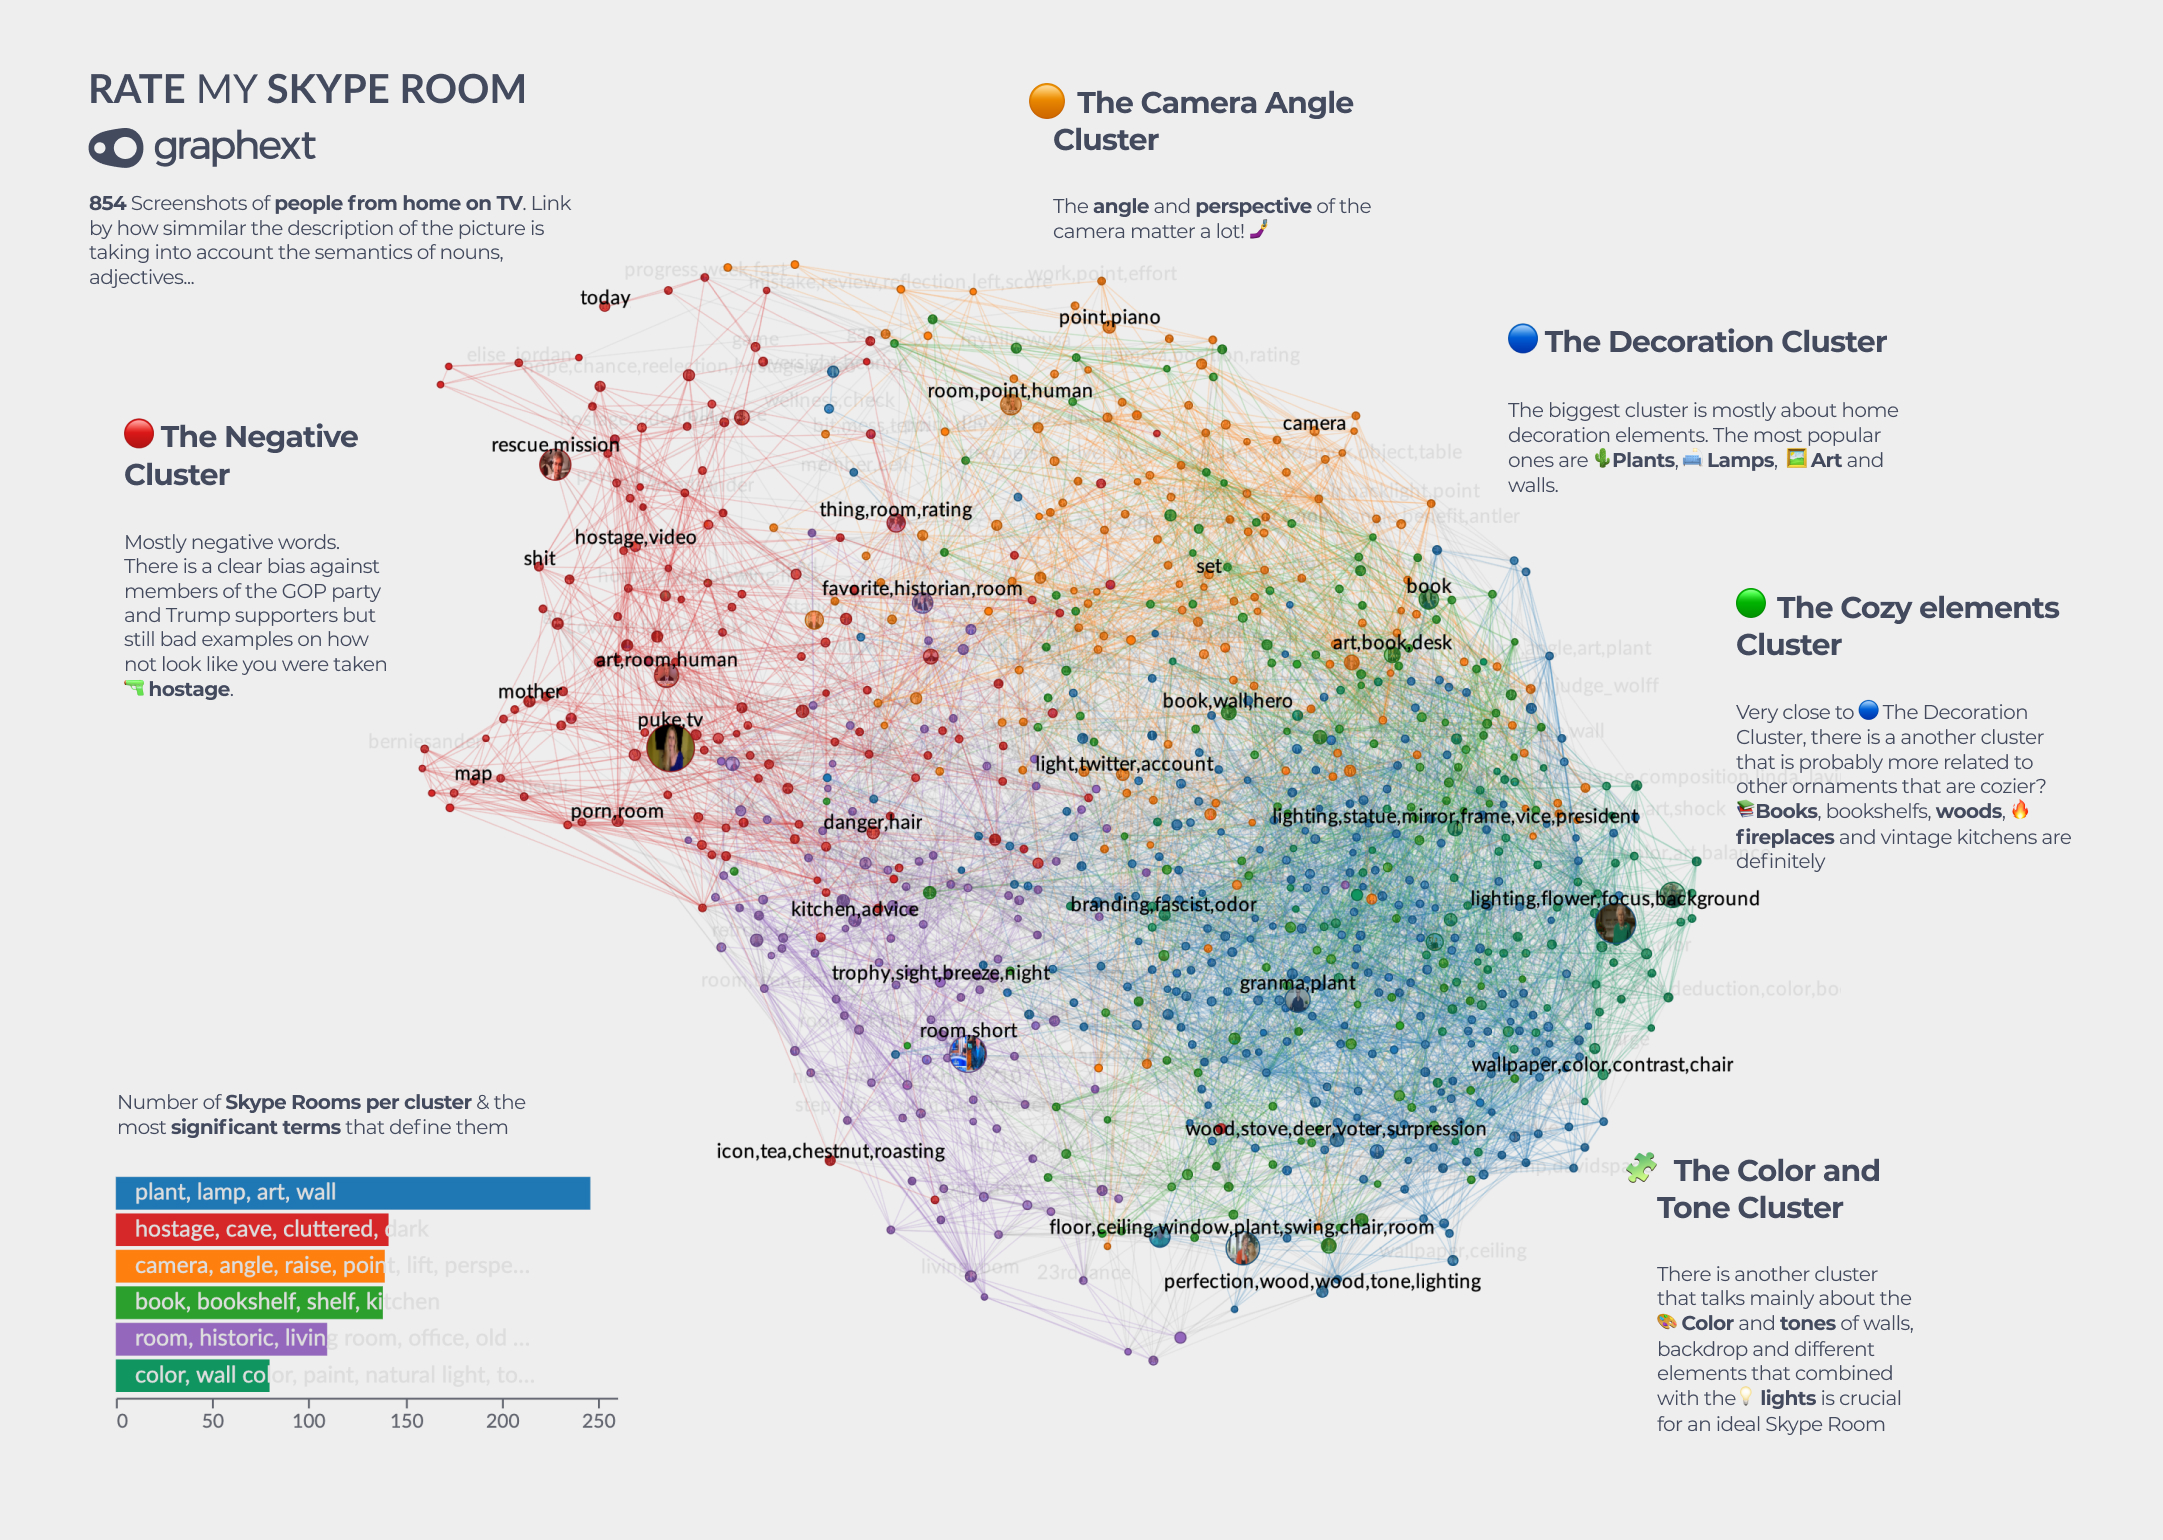
Graphext has done a great job building a platform that makes it easy to load data and create annotated insights against a wide array of data.
- For those looking to learn more about knowledge graphs and, in particular, the fundamentals of ontologies and taxonomies I recommend this pair of articles from Jo Stichbury written for UK graph startup Grakn Labs.
- Hat tip to reader Lake Heckaman who reminded me that I neglected to mention the announcement from Stephen Wolfram on the culmination of research into the “Path to the Fundamental Theory of Physics”.
As Lake notes the article covers the use of “multidimensional hypergraphs to build a generative model of the universe.”
I think it’s natural at this time of lockdown to feel as if you could be more productive. Whenever Wolfram’s name is mentioned nowadays I can’t help but think of the following photo from this article:

Stephen is sporting his strap-on, walking computer desk to get some exercise whilst simultaneously crushing beefy problems in theoretical physics.
- Interactive origin-destination app flowmap.blue was featured back in source/target #3.
Since then there’s been a hearty update to the app with the addition of a slick timeline. Creator Ilya Boyandin is presenting at the Zurich Data Visualization online Meetup later this month.
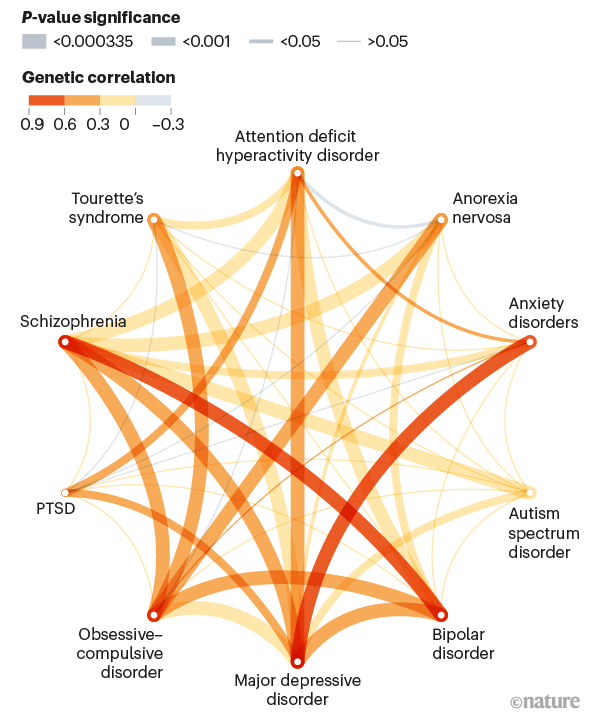
- A neat circular network diagram illuminates an important topic to life in a recent news feature from Nature:
- Finally, popular writer David Perell highlighted this depiction of the Disney business plan:
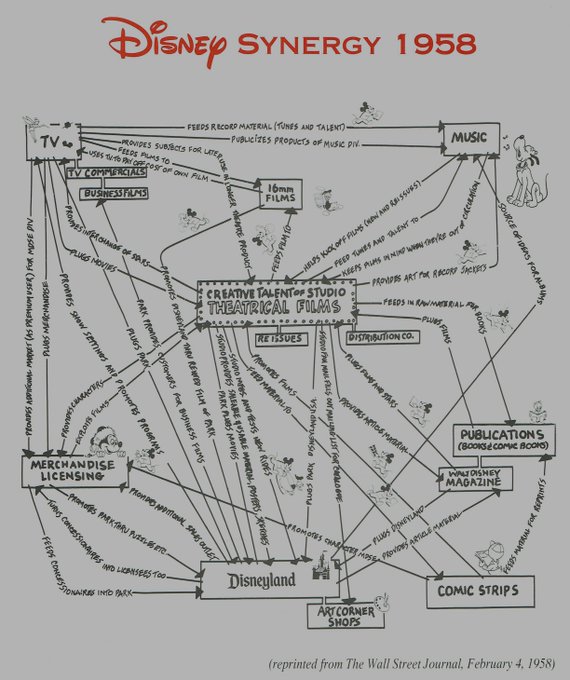
I’m a big fan of the illustrated aesthetic and love the hand-annotated links. Read the comments on Twitter for extra context and some recommended reading.
Thanks again for subscribing to source/target, I hope you and yours are safe and well. I’ll see you again in just under two weeks.