Hi, I’m Christian and this is a newsletter with interesting content and links orbiting the world of graph. This is number 6 which means we’re (somehow) a quarter of the way through 2020.
I reached a minor milestone this week: 100 subscribers (and counting)—thank you for signing up and for your comments and feedback. I have a few tweaks to the format I’m looking to try but overall I’ve enjoyed putting this together every other week. I hope you’ve enjoyed it so far.
Feel free to forward this to a friend if you think they’d like it. You can respond directly to this email if you have any feedback or suggestions.
Graphs
For obvious reasons there’s been an incredible uptick in webinars and conferences switching from meatspace to online over the last few months. Many pre-existing events are making necessary switches but on top of this, there’s a global bid to occupy the attention of everyone self-isolating. This is especially the case for all parents juggling jobs and childcare.
On that topic, I watched something a little different this week: Data Visualization Pro Elijah Meeks presented an introduction to networks and graphs to an audience of Grade 5-9s. It was far-reaching and a valiant effort at engaging his audience with what could have easily become a very technical discussion to a group of distracted children:
As a graph practitioner, I found it refreshing to look at the field from a complete beginner’s standpoint and was reminded of the far reach of our space. The children on the call seemed genuinely interested in the networks that they interact with every day (Family trees! Computer networks! Transport between home and school!)
One interesting, real-world network that Elijah showed—and one I had completely forgotten about since elementary school—was the food web. For those who don’t remember, this is a network of the animals that consume other animals and often looks something like this example from WikiHow:
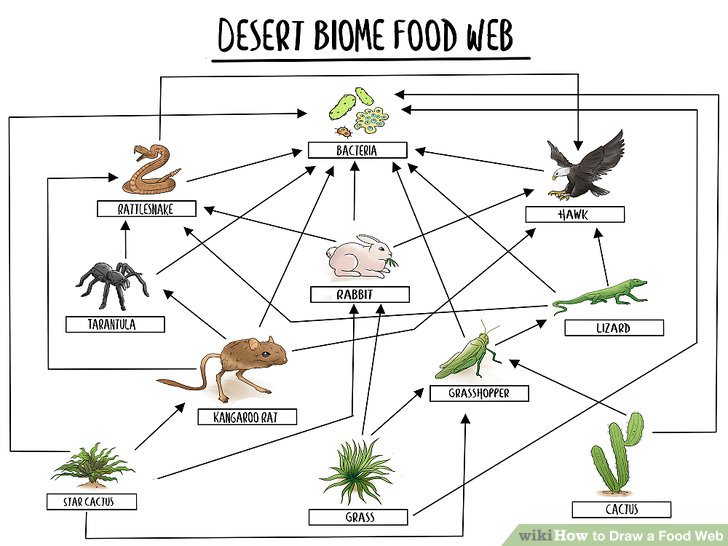
I remember being fascinated by this concept at school, particularly how far-reaching the web was and how you seem to be able to keep drawing it forever. Analysts and other graph users seem to love calling network graphs “webs”, perhaps it’s a holdover from the fabled “world wide web” and tangible “food web” taught in school?
The idea of a food chain has been around since the 10th century, courtesy of Arab scientist and philosopher Al-Jahiz. The contemporary use of the “food web” concept (the one I remember from school) appears to derive from Charles Elton’s “food cycle” defined in his book Animal Ecology from 1927. The earliest known published example of what we call a “food web” is the following weevil-focused graph from Pierce, Cushman & Hood (1912)
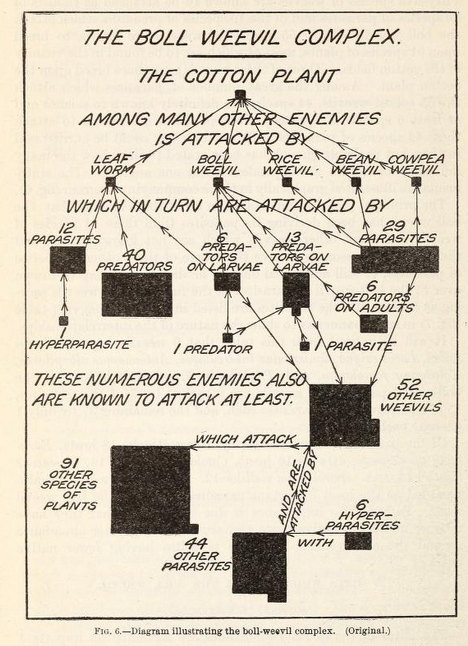
I love the decision to summarize the types of species in this graph with shapes built of tessellated squares. The authors already understood the seemingly infinite connections between species. For a larger, more recent example take this “simplified food web” — it’s almost unintelligible!
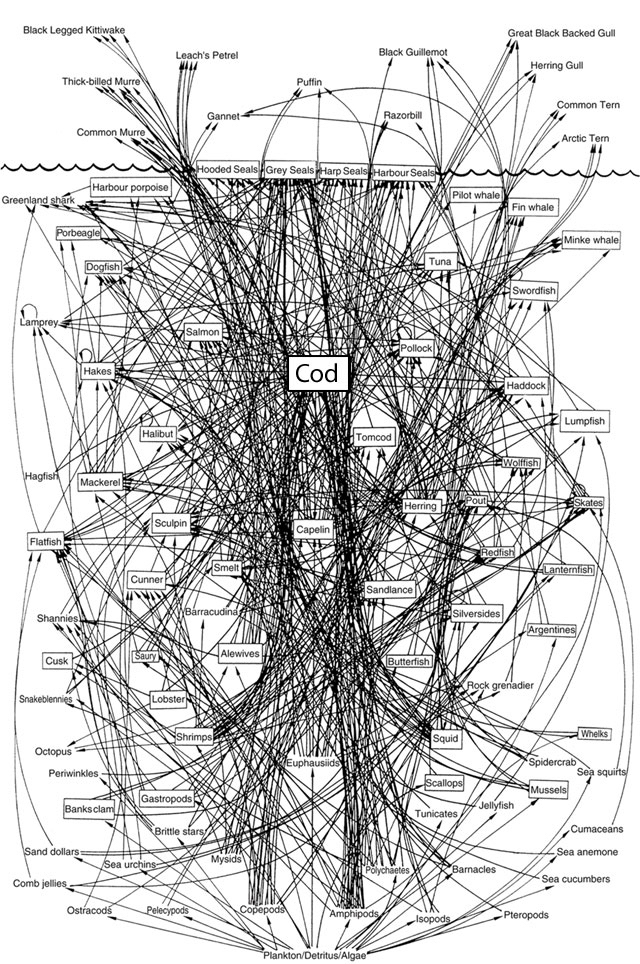
— David Lavigne (2003). Chapter 2
It turns out this is perhaps intentional:
Food webs are the road-maps through Darwin’s famous ‘entangled bank’ and have a long history in ecology. Like maps of unfamiliar ground, food webs appear bewilderingly complex. They were often published to make just that point.
– Pimm, S. L.; Lawton, J. H.; Cohen, J. E. (1991). “Food web patterns and their consequences”
I recognize some some core graph features intrinsic to a food web such as the above:
Directionality is important. The arrows indicate which animal preys on which; if you were to switch it around it wouldn’t make any sense.
Self-links are also a thing. After recoiling at the complexity the first thing I noticed in this graph is that certain species are cannibalistic:

Self-links or loops are often a bane for graph analytics but in this case they’re an important part of the ecosystem.
Finally just like in the above (highly scientific) WikiHow example of a desert biome, we’re always going to find supernodes at the centre of our ecological communities. One classic species playing this role is “bacteria”, meanwhile, the Northwest Atlantic web seems highly-dependent on “cod”.
The intersection of graph and biology is vast; I’m barely scratching the surface of this topic and there’s a reason one of the most popular graph platforms was originally for biological use-cases. But for the layperson, food webs are yet another example of an engaging window into a rich & compelling world of connections.
Nodes
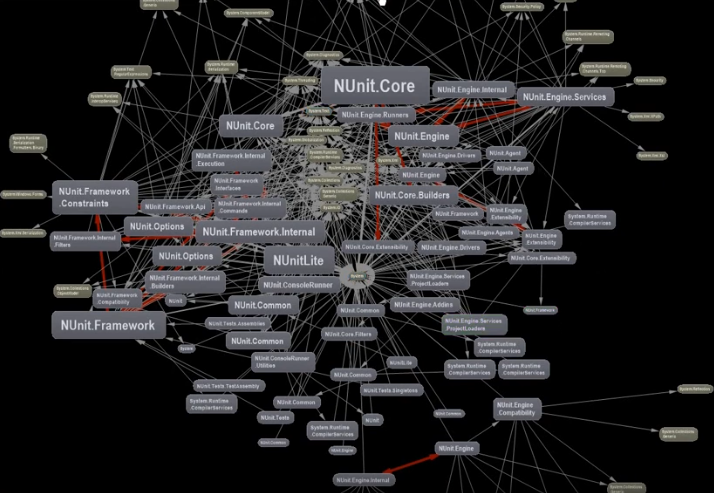
Last edition I took a look at a number of graph tools built to help developers understand the source code behind applications. I focused on tools that help highlight and enforce rules around quality as well as the dependencies between components and third-party code brought into a repository. One such tool I didn’t get a chance to mention was the Visual Code plugin nDepend which has a dizzying array of features for visual exploration of codebases.
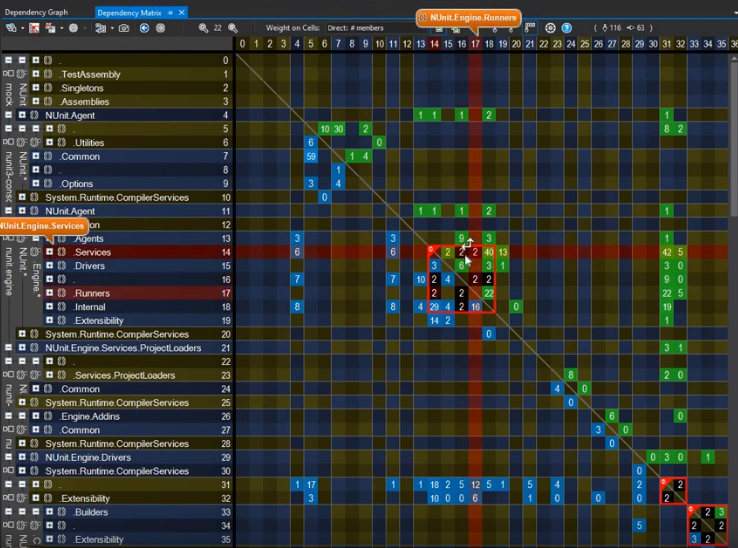
I was taken by this video that focuses on the benefits of using a dependency matrix representation of a graph over the more common-place node-link diagram. Matrices vs. graphs is a topic I want to cover in more depth because this is a perfect example of function over form (as you can see below).
Another graph underpinning source code repository is that of the individuals contributing to codebases. Gource, an especially vibrant multi-platform application that’s been around since 2009 and it definitely has to be seen. Take a look at this recording from last year visualizing the development of the core code behind cryptocurrency Bitcoin.
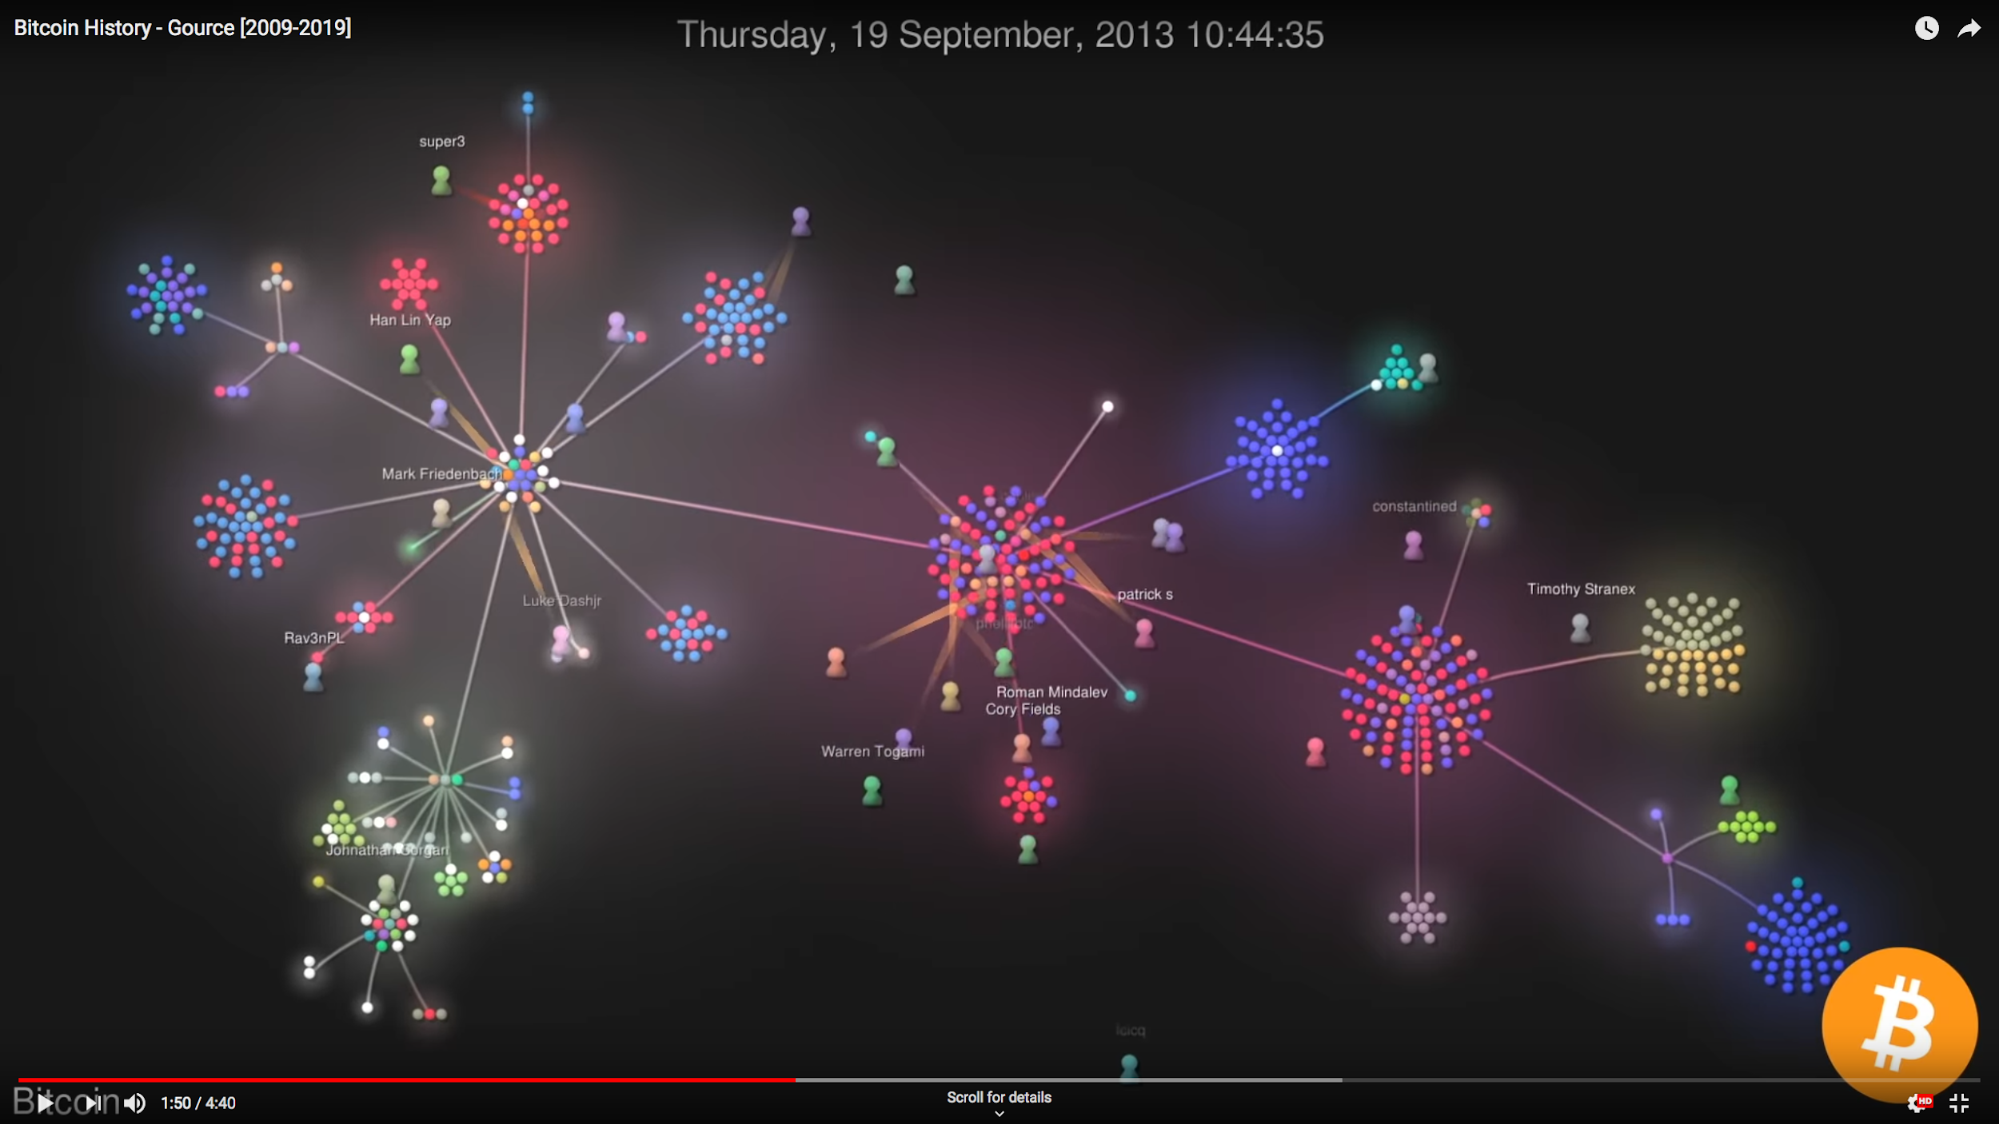
I’ve used Gource to visualise a number of repositories over the last 8 years and it’s never failed to produce interesting and eye-catching results. This is especially true when showcasing results to an audience composed of contributors to the source code repository being visualized.
The thing I like the most about Gource is how dynamic the visualization is: seeing individuals flying around the screen creating and editing files with gusto is really fun. I often talk about focusing on the utility of graphs and the need to be cognizant of the actual benefit of “thinking graph” rather than being distracted by pretty pictures. However with a tool like Gource I certainly think there’s a middle ground for a sort of non-functional benefit. Seeing contributors move around like superheroes can bring energy and camaraderie to a team as it really highlights the work ethic and contribution of developers to a code base. It’s inspiring! In this article Leonardo Faria (Thinkific) describes this exact use-case: showing off team contributions to code bases at monthly Product town halls.
Another strong use-case for using graphs to explore source code repositories is to aid program comprehension. It can take hours, days, even weeks to “grok” or understand a new codebase. Any tool that can help with this situational awareness can help reduce a major cost factor in maintaining software systems.
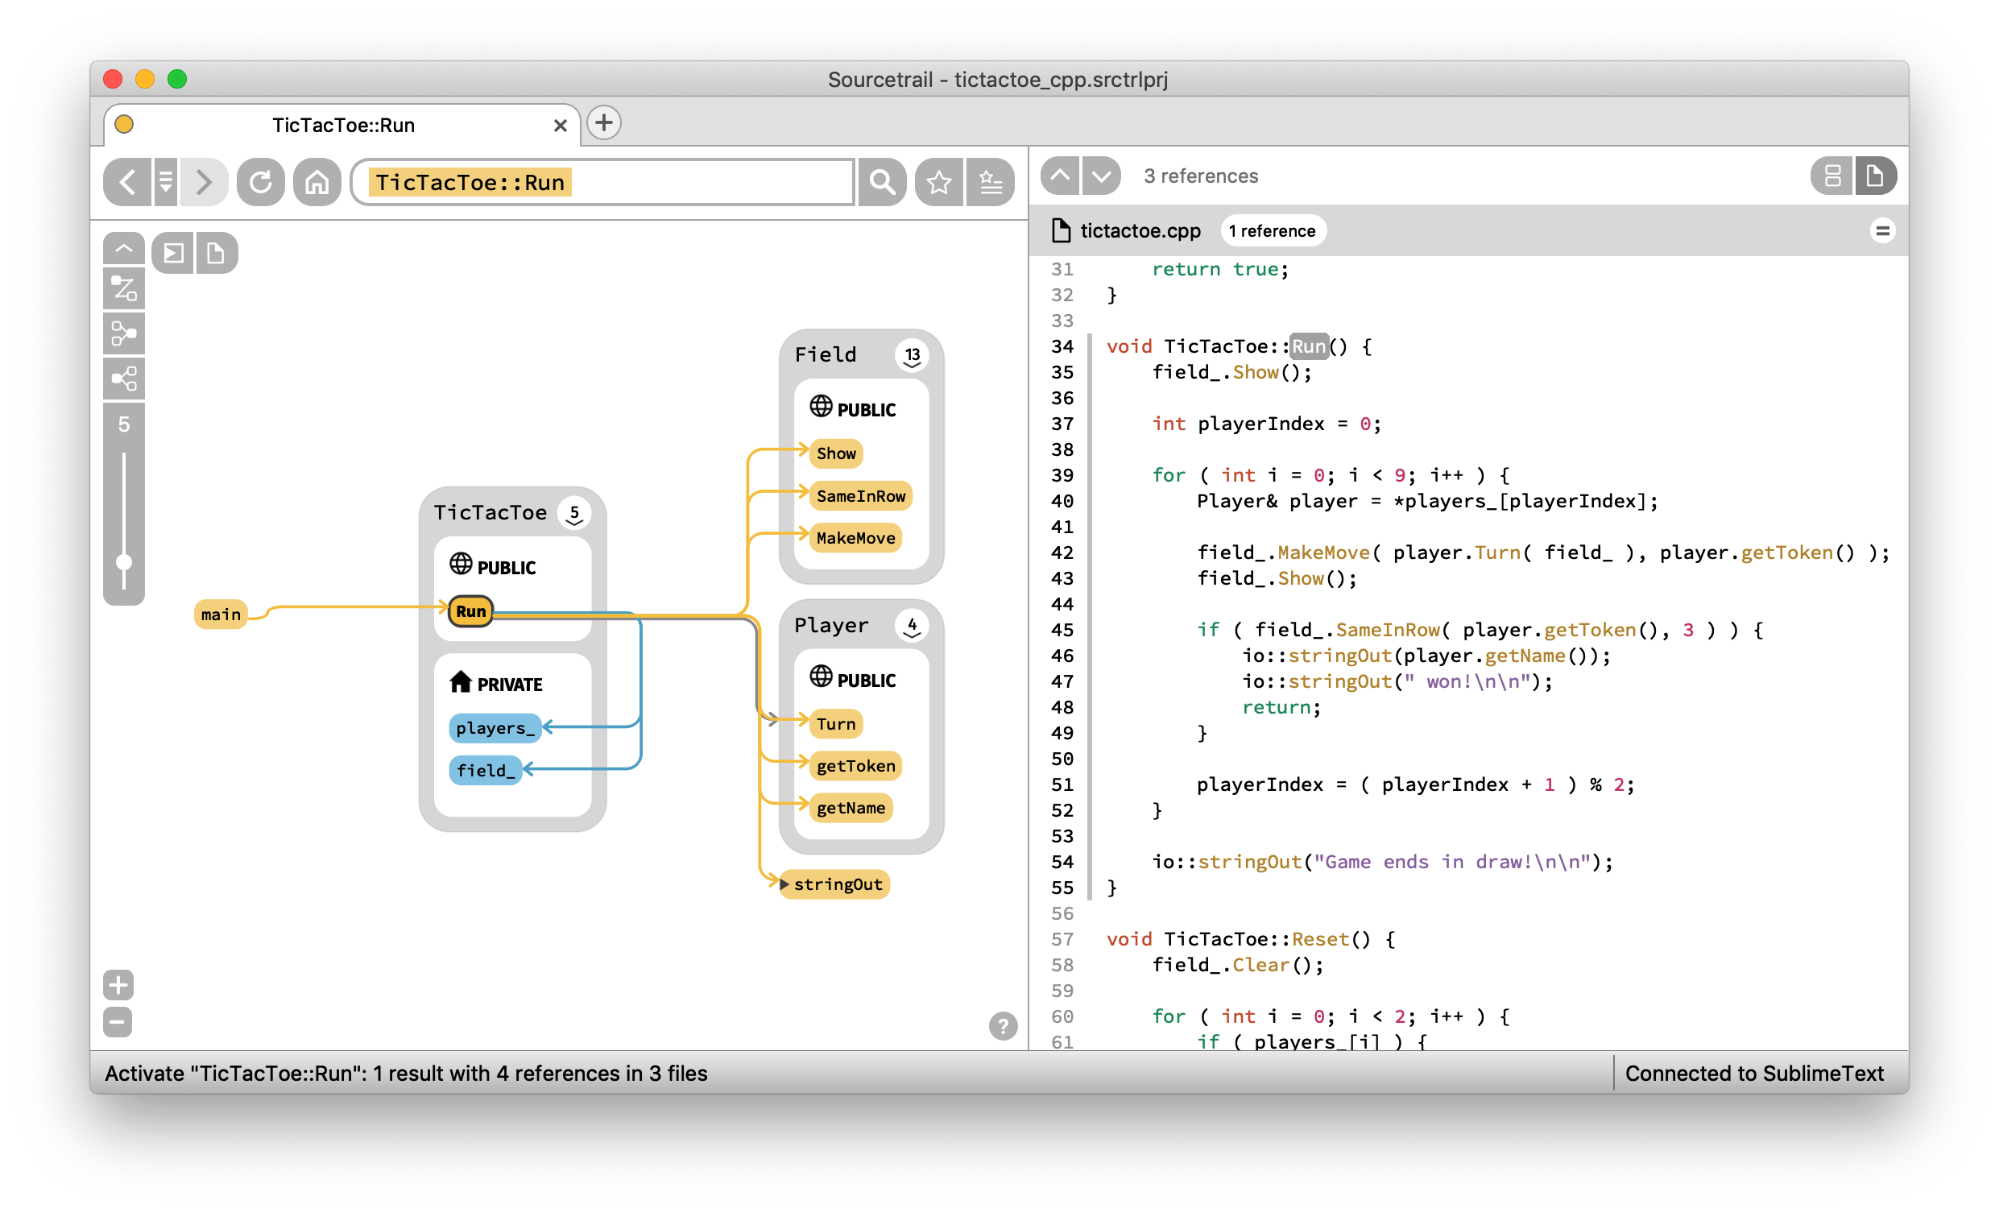
Open Source software Sourcetrail looks like a great approach for C, C++ & Java developers. Check out this walkthrough from Bartłomiej Filipek for an exploration of the benefits and pitfalls.
Links
I’m looking forward to attending the (digital) Knowledge Graph Conference as they have a stellar line-up and there’s no travel costs required.
Graph database vendor Neo4j have just announced Connections, an online event with a focus on graph data science.
Here’s a nice primer from Karthik Deivasigamani (Walmart Labs) on building a product knowledge graph, in particular using heuristics and Natural Language Processing to extract entities from titles and descriptions.
Arrows is a very popular tool for prototyping and diagramming, this article from Ljubica Lazarevic (Neo4j) has some great tips and tricks for working with the tool. I feel a lot of these tricks should be integrated into the tool. Perhaps this directed graph editor from Uber could be a good basis for a fresh approach to Arrows?
Thanks again for subscribing, I hope you found this week’s edition interesting. See you all again in two weeks time.