I’m Christian (👋) and this is my bi-weekly (fortnightly?) newsletter with interesting content and links orbiting the world of graph.
Graphs
Album of the Year
Do you ever think about how many different types of music there are in the world? Across time and history the amount of music that has been generated is astounding – enough for infinite lifetimes of headphone-wearing.
We’re nearing the end of the year, a time full of festivities. One familiar tradition for me is that of the “Year End List” – a time when online and offline media converge in their desire to rank the songs and albums released in the past year. It’s a curious tradition on a arbitrary scale – what about the calendar year makes it suitable to split and rank record releases? Surely an album released in January is likely to be lost in the noise of the year in favor of a Summer or late-fall hit?
One project that puts this into perspective is that of British comedian James Acaster. While handling mental health issues Acaster distracted himself by pouring over records released in 2016. His efforts spawned a book, podcast and expansive coverage on his site of 350+ albums of note from 2020. In a recent interview Acaster suggested that 2016 was a turning point in the music industry: it suddenly feels impossible to listen to all the music released in a single calendar year.
Another way to look at the vastness of music can be found on “Every Noise at Once” – a fascinating project that plots out thousands of genres from Spotify. The site is deceptively simple but once you click around and play snippets of different musical styles you’ll quickly realize it gives a unique window into an astonishingly diverse set of music. Drilling down into a newly discovered genre, you’ll be rewarded with additional text maps of artists also grouped by similarity. It’s amazing.
I’m also a fan of Radiooooo and the inimitable Poolside FM.

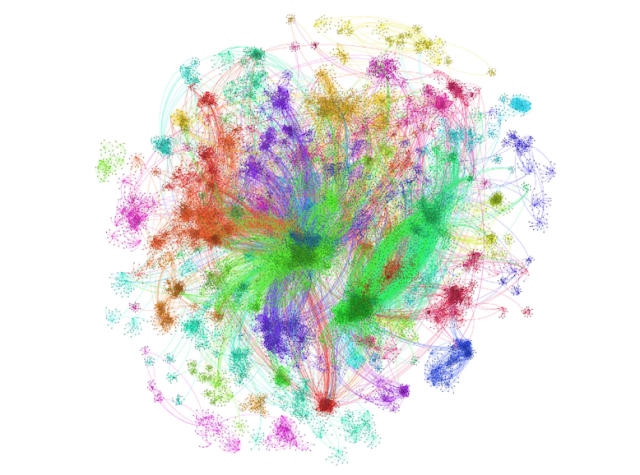
Every Noise at Once is a link-less graph, otherwise known as a scatter plot. The node locations reflect the underlying music:
The calibration is fuzzy, but in general down is more organic, up is more mechanical and electric; left is denser and more atmospheric, right is spikier and bouncier.
The core concept is adjusted in a number of ways on the site. In “The Sounds of Places”, for example, countries are mapped “not by their coordinates on the crust of the Earth, but by the acoustic characteristics of their music.” There’s also a neat breakdown of the most popular music of 2020 from around the world.
YouTube to the Core
Another revival of esoteric music has occurred courtesy of YouTube, the largest music streaming platform in existence. When listening to music using YouTube the addictive sidebar of recommended videos is a graph of musical journeys just clicks away.
Coined “YouTubeCore” a delightful article from Ars Technica this week loosely defines the genre:
admittedly open-ended in terms of genre and style, but for our purposes, we can limit it to soft, instrumental fare—specifically, an algorithm-driven hierarchy of ambient albums that leans, for one reason or another, to the island nation of Japan.
This isn’t a small trend, we’re talking millions of views and enough new fans to surprise artists and even bring them out of retirement. Due to YouTube music licensing policies these views can result in significant compensation for artists, sometimes considerably more than on other streaming services.
The algorithm behind this phenomenon is unknown to us YouTube outsiders, but this hasn’t stopped some researchers:
Massimo Airoldi, a professor at Emlyon Business School, co-authored a 2016 paper titled Follow the algorithm: An exploratory investigation of music on YouTube. It proposes that the algorithm partially leans on sequential viewing: if a significant number of users watch video B after video A, the two are considered related and therefore recommended.
Within this framework, genres stop being simple technical distinctions and become granular concepts based on crowdsourced human-behavior patterns. Utilizing network analysis, the study estimates that viewing habits cause the algorithm to connect videos via recommendations, thereby knitting tight genre cliques in the process.
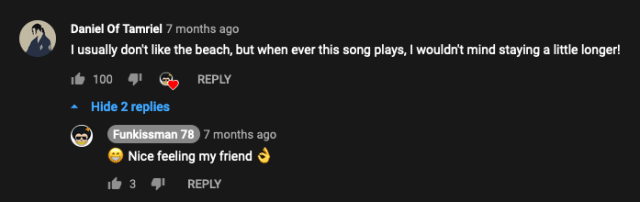
After years of significant negative press it’s refreshing to hear a seemingly positive result of the YouTube algorithm at large. What’s more the comment sections on popular YouTubeCore videos are a surprisingly wholesome place.
You have been listening to
This week’s source/target was brought to you by all the music I stumbled upon during my “research”:
Klaus Doldinger’s Passport - Schirokko (1973) – Amazing dueling drumming at the end
Herb Ellis & Remo Palmier – Windflower (1978) - Generous jazz
Tatsuro Yamashita - Sparkle (1982) - Powerful intro
Beckett - Four (2016) - Turns out I have a soft spot for *checks notes* “synthwave & talkbox with a backdrop of 80s beats”
Nodes
Sourcerer Jan Žák has put together an experiment in Observable that showcases a great technique for reducing network complexity. By reducing the proportion of edges drawn in a graph you get a visual shorthand for the density and connectivity of the nodes.
Partial Edge Drawing (PED) graph visualization experiment https://t.co/CILvt04kxB #observablehq
— Jan Žák (@zakjan) November 23, 2020
I see this as a good middle ground between a link-less graph and an overwhelming hairball. I think it has the potential to be used a lot more in other applications.
I’ve been thinking about the breadth of topics I cover in source/target and wonder if I could make it easier for readers to pick out the content they are most interested in. Images are a great way to do this but time-consuming to add and curate. Perhaps a little tag icon or similar would be good? What do you think?
All that’s to say there’s some fantastic data art out there so please imagine a little “data art” icon here:
Cursor Home from Sophia Schomberg and Nikolaus Baumgarten is a trippy journey into a seemingly-infinite world of working from home and graph motifs. Also see their amazing prior work Arkadia.xyz.
A mixture of data art and ruminations into the role of data, Stefanie Posavec’s sketches as part of her art residency with People Like You are a delight. Updates will be posted to her Instagram.
First round of sketches from my @PersonalisePLY residency, understanding how those who work w/ medical ‘big data’ perceive the ‘people behind the numbers’ who consent to their data being used and stored for future research.
— Stefanie Posavec (@stefpos) November 30, 2020
Follow my IG for updates: https://t.co/nAO2Urlh7D
/1 pic.twitter.com/Hrgkv3Ezvu
Stefanie has been producing beautiful work for years: one project that caught my eye was a “Literary Organism” piece from Writing Without Words which
explores methods of visually representing text in order to highlight the similarities and differences in writing styles when comparing different authors
In this case the first part of On the Road by Jack Kerouac.
Another was the lovely “Relationship Dance Steps” , a graph project from 2013 that slips into the physical world in the form of spatially-aware dance steps.
Popular design podcast 99% Invisible recently featured another podcast on the Enron collapse, in particular the email data released by regulators in 2001.
When these emails became public, for the first time there was a database of thousands of real emails sent by real people that were available to the public, and researchers.
The episode touches upon the novelty of a public dataset of these real connections between people. It serves as a solid introduction to graph analytics from an interesting origin.
Links
Today I present at @ivconf a conference paper titled "Drawing Network Visualizations on a Continuous, Spherical Surface." The pre-print is available on Google Docs at https://t.co/f9DLxkcFtc pic.twitter.com/2Ku13xybL6
— Dario Rodighiero (@dariorodighiero) September 8, 2020
- Flat Network Conspiracy: Drawing Network Visualizations on a Continuous, Spherical Surface
- F1 Constructor Standings 2010-2019
- Clubhouse referral graph scraped from the web
- Constellation - free Open Source, graph-focused visualization and data analysis application
- Experience Network Science Through Play: thoughts on building a board game influenced by network science
Why not share this edition with someone you think would enjoy it?