Graphs
There’s a reason it’s called link analysis: Graphs are links. Looking and analyzing graphs without links is using a laptop without an internet connection or meeting people without forging relationships.
Strictly speaking graphs without links are graphs – a hill I’m happy to rest on for a while.
Classifying the many different types of graph links leads us to theoretical definitions of “bidirectional,” “multiplexer” and other leaden terms. These are helpful but let’s cast our net wider than graph theory and social network analysis and consider an alternative classification of links.
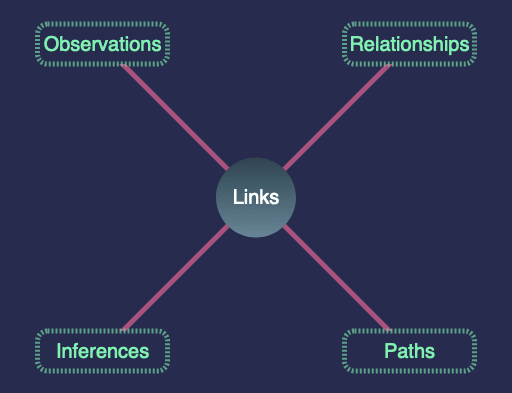
I’ve split all possible link types into four distinct categories: Relationships, Paths, Observations and Inferences – something I’m going to call the OIPR model of links.
Relationships
If I were to ask you – quick – “what’s the first network you think of?” I suspect the answer would be that of a social network. Your social and familial connections from the real world, represented in the digital one.
The links in these networks are relationships. You may have a husband, a sister, a cat or (hopefully) at least one friend.
Our relationships can also be less concrete – you could have an acquaintance or a tenuous, globe-spanning relationship with, say, the person who reverts your Wikipedia edits.
Graph modelling guides will tell you that the best graph models use verbs to describe relationships: father of, babysitter for, etc. This is good advice but it’s interesting to note that these verbs are invariably passive.
This way of describing a relationship could lead us to think of these relationships incorrectly, after all, what do they mean to an outsider looking in? In this graph, being a mother or owing someone money isn’t about what that intimate relationship actually means to those individuals, but how viewers perceive and respond to that relationship in their own understanding of the world.
Paths
Paths are found in networks all around us but they are commonly understood in the geospatial context. What’s the shortest route between A & B? Can I reach the museum by bus? Will my new apartment have fibre?
There’s a strong overlap between networks and the world of optimization: What’s the software dependency chain with the fewest elements? What task do I need to complete to get this off my plate?
Observations
There’s a difference between the existence of a path and the action of taking it: we travel along paths all the time.
It’s helpful to generalize this path utilization in an “observation” link type:
- I have a path to a conference call at any time, but the observation of that call is the event of running the meeting.
- Supply chains reflect the real-world path of product from one location to another. The utilization of that path is an observation – a system running as it is intended.
Observations can take advantage of projection: you and I may join the same conference call via a service like Zoom but it’s the co-occurrence of us on the same call that’s interesting to a social network analyst. On the other hand, a Site Reliability Engineer at Zoom cares more about the volume and structure of the many thousand of Zoom calls than the relationships forged.
After about a year of COVID all my examples gravitate to be about online meetings.
Inferences
A common trick in network analytics is to take a relationship or observation network, defined above, and derive fresh – sometimes artificial – links out of their raw structure.
One example of this is an inference, commonly used in semantic knowledge graphs: I’m your brother and you have a wife, so they must be my sister-in-law.
Another example is an inferred similarity. Here’s a project I found this week that demonstrates this:
TV Tropes seeks to be a comprehensive breakdown of every trope that has ever graced popular media: a familiar storyline, a narrative device, visual shorthand for a common theme; no matter how vague the trope, it’s likely documented here.
If you’re not familiar with TV Tropes there try clicking the random trope button a few times to get a feel. Their page describing a number of “Forgotten Tropes” is also interesting to see how certain tropes have fallen out of favor.
Diving into the vast web of tropes is a task that rewards the reader with a category mapping of shared tropes. This network is neat but isn’t illuminating. It’s a summary of the most popular tropes, sure, or a pointer to popular TV sitcoms with cliched, lazy, but accessible storylines.
These links, by the way, are examples of “observation” links – we’re observing a certain trope in a TV show or movie. If we assess how often tropes are observed between shows a naturally interesting network with a different form of link bubbles up.

Taking advantage of a technique called Jaccard similarity, Reddit user /u/theotheredmund analyzed the TV tropes database and created this visualization of interconnected tropes. What’s remarkable about this is the neighbourhoods of various TV shows. We see a “late night comedy” cul-de-sac, a “Law & Order” lane, a terrace of sitcom titans and a side-alley of sci-fi shows brought together by the tropeful Babylon Five.
/u/theotheredmund describes their process:
For each pair of shows, I count number of tropes that exist in both shows and divide by number of tropes that exist in either. That’s their “similarity.” Then I go through each show and find the most “similar” other show, and link it. So a chain indicates that show A has most in common with B, but B might have most in common with C, onto D, E, etc.
TV Tropes is manually curated and there’s sure to be some artistic license on theotheredmund’s part when building this visualization. Regardless, I think these are a different type of link to a relationship, path or observation.
For another example of a similarity graph check out source/target favorite Andrei Kashcha’s sayit project which, given a subreddit, shows a graph of related subreddits.
Linking links
Many networks could have links that span across different pairs of the above classifications. I’m struggling, however, to think of a network link that isn’t covered by any of my definitions of observations, inferences, paths & relationships.
What do you think? Have I missed an obvious link type?
Links
Nodes
I attended the Outlier 2021 conference this past weekend. It was a wonderful collection of talks by data visualization practitioners from around the world. I really enjoyed the emphasis on an asynchronous experience: it would be (almost) impossible to catch all the talks live as they spanned a number of timezones. The recordings, transcripts and collaborative boards & docs meant it was rewarding to catch up on talks that happened while you were sleeping. As a virtual conference it also afforded a “rest day” on the Saturday, a smart decision from the organizers.
Outlier helped me find a number of people doing great work in the graph space and I’ll be showcasing their work here in source/target. This week I’m starting with two delightful projects from Krist Wongsuphasawat.
First up we have SentenTree, a novel way to summarize text by plotting the various deviations and forms around a topic from social media. It’s a generalized but streamlined approach to my Song Lyrics Graph project. It’s intuitive to see the sentence variants play out across the screen and see the sources in the tooltips – I vastly prefer “SentenTrees” to word clouds!
Most people are probably over Game of Thrones by now but I like this project giving another summary of tweets. This time we learn more about the characters discussed together as well as the emoji used in the various tweets.
Like my link classification from earlier, these projects showcase observation links: we both observe the paths taken by words in sentences and observe the co-occurrence of characters from Game of Thrones in a set of tweets.
For more insightful visualizations check out Krist’s projects page.
While we’re on the topic of Twitter, this thread on US Election voter fraud claims Andrew Beers is worth a read.
Here's a thread on this graph I made, which has been bouncing around Twitter a bit. Broadly, it shows the connections between "influential" Twitter accounts during the election.
— Andrew Beers (@beeeeeers) February 6, 2021
But it's always more complicated than that with networks! Here's some insights you might be missing. pic.twitter.com/OSpxS2aR7c
Here’s an accompanying Nature article on the work.
I was almost finished up for this week but I spotted this fantastic project from the Open Syllabus Project:
Excited to release a big update to the @opensyllabus Galaxy visualization today, which shows node2vec -> UMAP embeddings of the OS citation graph. Now showing the 1.1M most-assigned works. Using the @RAPIDSai UMAP implementation, which is amazing! https://t.co/uepz5vlL6N pic.twitter.com/jJNh78Ecn8
— David McClure (@clured) February 10, 2021
It’s a wonderful implementation with a detailed technical write-up over on their blog. Impressive stuff.
My source/target anonymous survey is still open, I’d love to know what you think! See you in two weeks.