Graphs
I used to work with someone who would take weeks off work to do nothing but watch the Olympics. Summer or winter he would close the blinds, order takeout and multi-screen his way through a slew of sporting excellence. He was predictable like that.
Predictability in sport is a big deal. Everyone wants to know who will win various qualifiers, heats and tournaments – and that includes the coaches and athletes in the middle of the action.
Unpredictability has its own allure. A few nights ago a commentator noted:
nobody in the world following table tennis would have expected Germany leading China 8-7 at this point
Surprise events like this are novel and fascinating to audiences. When you’re caught up in the action, it feels like anything could happen.
Sync or Swim
I’m drawn into the Olympics in a way that surprises me. This year is no different. I was glued to the new skateboarding and surfing events, taken by the frantic energy of badminton mixed doubles and the frenzied paddling of the canoe slalom, and stayed up way too late watching “artistic swimming” - of all things.
My Olympic habits have dovetailed nicely with Wikipedia deep dives. Did you know synchronized swimming was renamed in 2017 to artistic swimming? And that athletes risk serious injuries due to concussion; wearing helmets during practice to avoid any mishaps? There were three sets of twins competing on Tuesday night, one pair were part of a triplet. I wonder what that family dynamic is like?
Glued to heat after heat of incredible athletes my mind wanders… Putting aside the complete impracticality (and potential offence caused by even suggesting it), what sport do you reckon you could qualify at Olympic level in time for Paris, 2024? I’m probably too short for basketball, not great with heights (no diving) and tap out at about 20 push-ups. That rules out the vast majority of events. No offence to badminton players but I suspect that may be my best bet. Of course, I’d have to quit my job to dedicate my life to the way of the birdie – and perhaps move to a different country?
Back of the net(work)
It’s 5am and I’m watching the women’s football gold medal game. It’s Canada vs. Sweden and there have been a lot of games to get us to this point. Looking back at the various qualifiers and knockouts we see a pattern that resembles a graph – this makes sense, in graph theory this network is classified as a “tournament.” It’s a directed graph where the direction matches who won their game.
One reason why these networks are interesting is that there’s a graph theoretical aspect to them. First there’s transitivity: if Sweden beats Canada and Canada beats the USA then it’s logical to say that Sweden is the better team than the USA. Another fact: it can be proven that all tournaments have what is called a Hamiltonian path. This means it’s possible to trace along the links of all nodes in a network without returning to any previously-visited node.
In the social network analysis context we can think of these tournaments as “competition networks” and look to graph measures for more insight. PageRank is perhaps the most famous graph measure and is similar to a much older technique called eigenvector centrality. Google famously used PageRank on networks of hyperlinks between web pages to approximate the relative importance of pages for their search results.
Taking this metric and applying it to tournaments makes a lot of sense. Instead of treating the existence of a link as a vote of credibility, we can take a win against another team as the transfer of a tiny bit of reputability. It’s very natural; you get kudos for beating a reputable, strong team. Football-loving researchers have undertaken a network-science informed comparison between this predictive model and betting markets. Their results?
Relying on large-scale historical records of 11 major football leagues, we have shown that, throughout time, football is dramatically changing; the sport is becoming more predictable; teams are becoming increasingly unequal; and home field advantage is steadily and consistently decreasing for all the leagues in the sample.
Or, to put it as succinctly as the title of the paper: football is becoming boring.
Civilian Equestrian
Dressage has been a part of the Olympic games for over 100 years. Prior to 1952 only officers in the military were allowed to compete at the games and it was common to see riders compete across decades of games. This rich history gives us a dense network of interactions to explore.
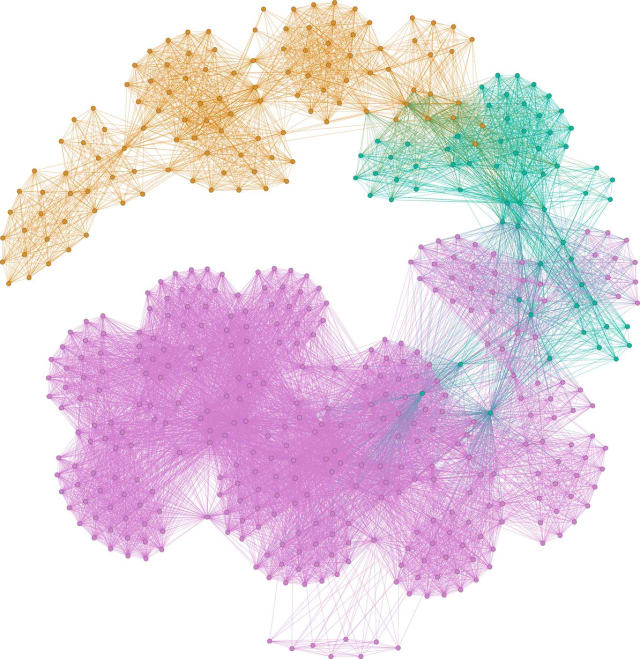
The use of colours in this visualization of the riders across the decades shows that those who competed immediately after the “demilitarization” of the dressage event didn’t last very long. Twinning colour with various time metrics is a great way to emphasize patterns in networks like this.
(Mildly unrelated but I read this week that all horses in the Southern Hemisphere have the same official birthday of the 1st of August. When I first heard this I thought it was an incredible fact but it’s not like all these horses were actually born on the same day. Imagine the logistics.)
Thanks to recorded championships and Olympic games it’s easy to find data relating to competing athletes. This slickly interactive site does for swimmers what PM_ME_YOUR_SADDLEBREDS did for horse riders. Graphs like this with inferred co-occurence links usually grow in size to be very strongly-connected but the strict cadence of the games across many years mean the resulting network is quite restrained.
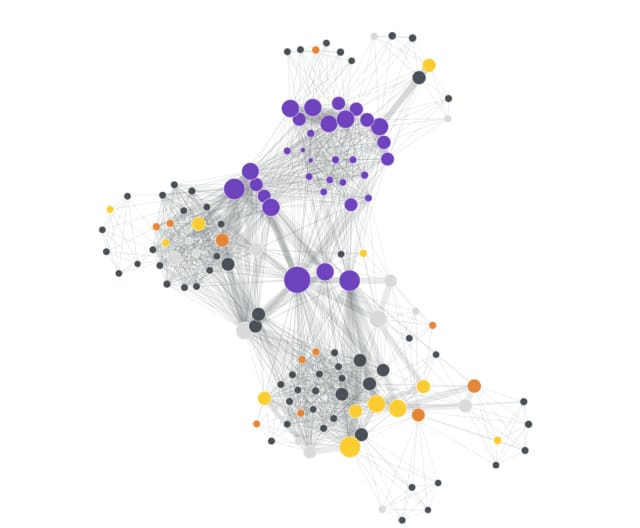
I recommend Tanyoung Kim’s three part series for background on the data preparation, visualization design decisions and insights the graphs reveal.
Topo 2020
Another sport making its debut in the Olympics is rock climbing. Back in 2017 it felt like everyone was talking about the documentary Dawn Wall. It’s an electric flick showcasing the incredible grit and determination of climbers Tommy Caldwell and Kevin Jorgeson as they plot to conquer the film’s namesake southeast face of El Capitan in Yosemite National Park.
(I heartily recommend two more movies with some overlap in subjects and directors: Meru and Free Solo make a fantastic triplet of climbing movies.)
One fascinating facet of the Dawn Wall is the painstaking lengths Caldwell and Jorgeson took to map out their route to excruciating detail. Rock climbing difficulty grades and rankings are serious business. I find it remarkable that it took this painstaking effort and decades of effort to do the climb but once it was mapped it was completed again just a year later by Adam Ondra. Showing it was possible was somewhat sufficient to allow others to do the same.
(Ondra was featured in a wonderful piece in the New York Times this week – worth a look if you can conquer the paywall.)
The climb route is, of course, just another directed graph. Nodes could be individual holds or, summarizing they’re the individual sections, or pitches. The links are the transitions between holds. It’s a multi-graph: there are often multiple ways to complete the climb. And of course, it’s directed because, for a climber, the only true way is up.
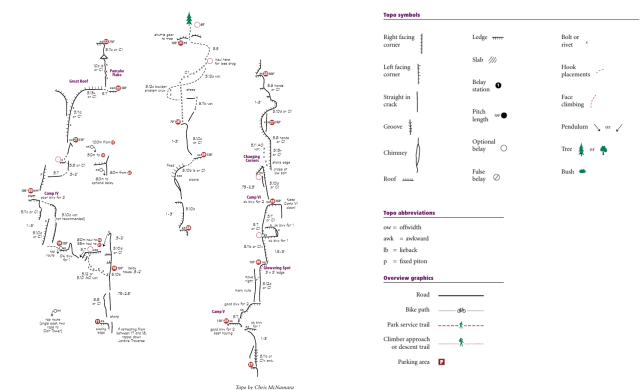
Depictions of routes are known as topos, short for topological diagrams, and often have a hand-carved feel to them.
Are we there, net?
Watch the Olympic diving and it won’t take long for the camera to pan to a person with an iPad – it’s always an iPad – filming the athlete as they take their dive. It’s amusing to see. Don’t they know the dives are being recorded by state-of-the-art cameras and simultaneously broadcast to millions of people? But training teams and athletes use as many modern techniques as possible to get the competitive edge in their discipline. It’s a key practice for Karate Kata athletes or “karatekas”; recording repeated runs of a routine for review. Over in the diving center, amateur iPad filming provides alternative angles and can be used between heats for last-minute tweaking and tuning.
Network science is used to gain a greater understanding of the mechanics of successful matches, teams and athletes. At its heart badminton, my new sole purpose in life, can be modelled as a bipartite graph. Every time the shuttlecock passes the net a new link is created between the positions of players at that point in time. The overall outcome is that of an “interaction network” between players as a complement to the competition networks of many games. The word “bipartite” means the passes are always between players on opposing teams (passing between teammates is not allowed in badminton, even for doubles).
One published study [pdf] aimed to quantify the performance of elite olympic badminton players.
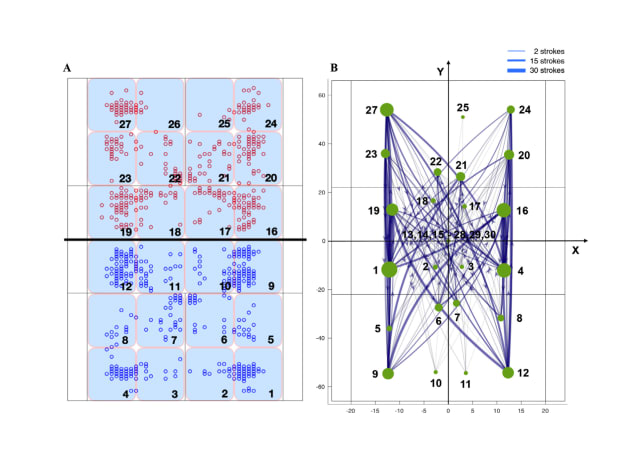
One pattern uncovered was predictability across medal lines:
The Badminton Stroke Network identified different playing patterns for medallists with the Silver medallist categorised with the less predictable and defined style of play, the Bronze medallist exhibiting the most defined style; and the Gold medallist exhibiting the greatest predictability, but only when losing points (self-networks).
It’s remarkable that medal classification can match such a clear split across play styles. This idea matches other studies, such as this research from the Carlson School of Management:
Hedgcock and his team compiled the largest dataset ever used to study this phenomenon and are the first to use facial expression software. Altogether, they studied medal stand photographs of 413 athletes from 142 sporting events, representing 67 countries, across five Olympic Summer Games between 2000 and 2016.
The results replicated and expanded on what was previously found: bronze medalists were more likely to exhibit a smile than silver medalists, while gold medalists were happier than other medalists.
Interaction network analysis can be applied to other sports. Volleyball game networks extracted from video footage have been used to question a common assumption: that there’s a direct relationship between particular patterns of game activity and whether a team wins or loses.
Using eigenvector centrality it appears that individual attack behaviours are actually more impactful to the game outcome than groups of actions taken by a team. Social network analysis techniques will lead us to stronger predictions across all disciplines.
Sportsnet
You don’t have to look too closely to find networks in your favorite Olympic sport. Historical data puts today’s athletic achievements in perspective, visual modelling is paramount to beat the world’s toughest peaks and cutting-edge network science helps coaches and athletes reach the upper limit of their chosen sport.
Now, if you’ll excuse me, I’m off to practice my backhand.
Links
- Visualizing a genome collection with CactusTrees – beautiful work from Maarten Lambrechts
- YouTube tutorial on grouping in network visualization
- Bike Sharing System movements in Helsinki
- Thanks to everyone who sent in this Starlink Tracker – it really hammers home just how many satellites have been launched in our quest for fast internet.
- Network Analysis Made Simple – Really nice collection of online notebooks for those looking to get started with networks in Python.
- GenderedToponyms – A study and visualization of gender distribution of eponymous streets. See also this article from the BBC.
Nodes
I don’t really want to draw too much attention to this article entitled “Why Young Developers Don’t Get Knowledge Graphs” but I am interested to hear what you think of it. Drop me a line and let me know!
VOSviewer is a new Open Source project released this week with an exceptional take on building co-citation networks. I’ve previously highlighted Connected Papers as a good application of this use-case, but VOS takes things one step further and applies a FlowMap.blue-like approach where you’re able to provide your own data through a URL. The resulting app can be embedded anywhere online and has some unique features and functionality. I’m not familiar with the installable application that inspired this work but there’s a custom layout algorithm included that seems to do a great job with most of the networks.
For all those horses in the northern hemisphere I hope you are having a great summer. We all seem to be in a tentative state of uncertainty but I hope there is truly that ray of light at the end of the tunnel. As you may be able to tell by the tardiness of this email, source/target is still on summer time. I have a couple of projects I’m excited to share in the coming months.
As always, thanks for reading! I’m going to leave you with my top three surprising moments from the Olympics:
Bronze
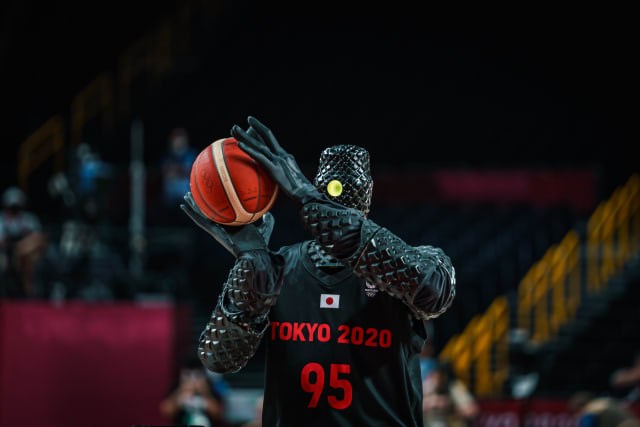
The terrifying basketball robot shooting hoops and taking names.
Silver
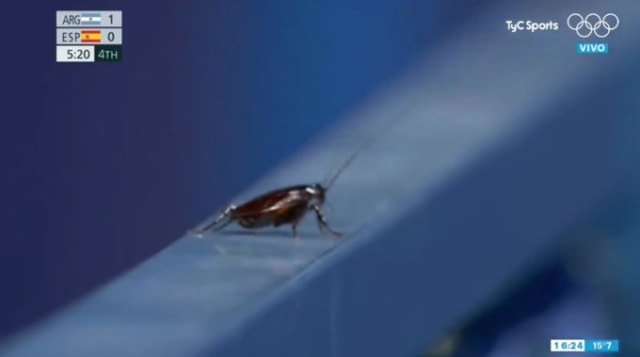
The time a cameraman panned to a cockroach instead of the final minutes of a women’s field hockey match. (Remarkably not the most notable insect of Tokyo 2020).
Gold
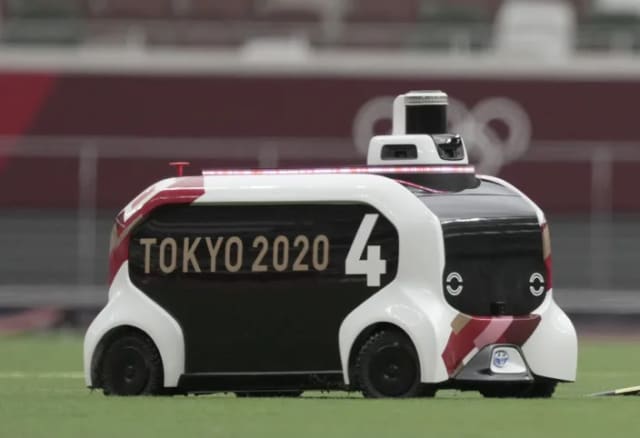
The adorable tiny cars “Field Support Robots” which exist for the sole purpose of shuttling equipment around the games.
See you in a few weeks!