I’m Christian (👋) and this is my bi-weekly (fortnightly?) newsletter with interesting content and links orbiting the world of graph.
Something a little different this week. To close out the year I’ve collated some of my favorite finds from the last little while.
twelve jugglers juggling
Siteswap, also called quantum juggling or the Cambridge notation, is a numeric juggling notation used to describe or represent juggling patterns. I had no idea this was a thing!
eleven lines aligning
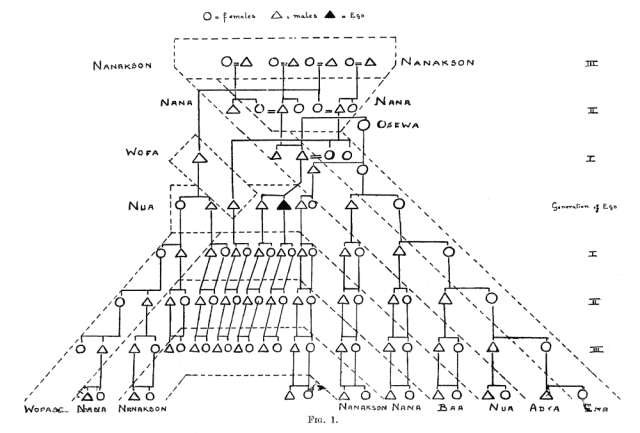
Exploring the themes and forms of lineage diagrams with Paul Kahn and DVS Nightingale.
ten graph formats
I’ve previously marvelled at the wide range of data formats used to represent graphs. Here’s a new one from Andreas Kollegger at Neo4j. Gram is a “textual format for data graphs” and it will look familiar to anyone with Cypher experience. The best place to get a feel for this new format is over on Kollegger’s Observable.
nine arrows pointing
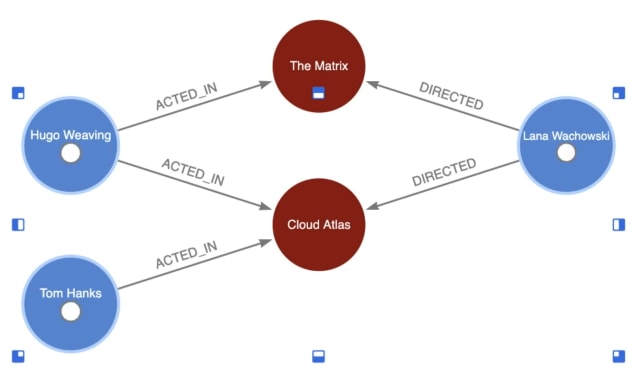
The Arrows graph drawing app from Alistair Jones has been reimagined and reimplemented under the Neo4j Labs banner. I gave it a spin this week and can already see using this a lot to prototype graph models.
eight clouds a-pouring
It’s officially the rainy season here in Victoria, B.C. Contrary to popular belief we actually get less rain here than in Vancouver or over the border in Washington. I like this visual breakdown of Seattle precipitation patterns from Eric Lo. It’s neat to see it integrated with his “WeatherWheel” for cross-filtering goodness.
seven trees a-talking
Trees appear to communicate and cooperate through subterranean networks of fungi. A fascinating article in the New York Times.
Before Simard and other ecologists revealed the extent and significance of mycorrhizal networks, foresters typically regarded trees as solitary individuals that competed for space and resources and were otherwise indifferent to one another. Simard and her peers have demonstrated that this framework is far too simplistic.
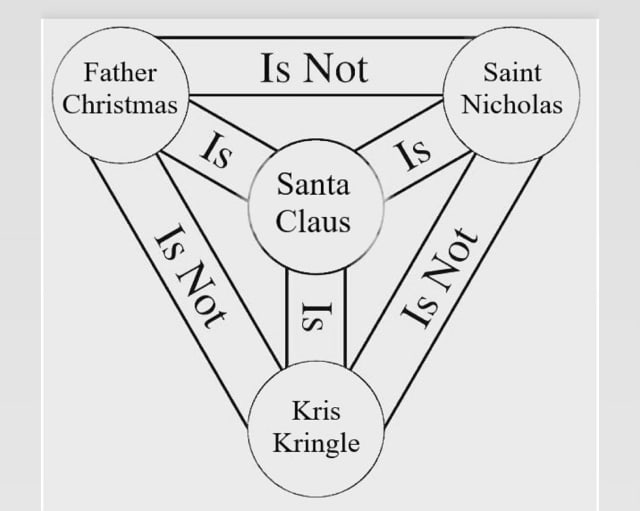
six: santa logic
I found this graph on Instagram (of all places!) and I have no idea where it’s from. Reverse Google Image searching it gives me thousands of results for the original diagram that inspires it: The Shield of the Trinity.
global A I
This article from Nature tracks the collaborations between AI researchers across institutions and countries around the world. I like the breakdown of local and international collaboration patterns.
four blackbirds
🎵 Simply having a wonderful Christmas (graph) 🎵
I really enjoyed this podcast interview with Sir Paul McCartney this past weekend. It spurred me to watch “Two of Us” (2020) starring Jared Harris & Aidan Quinn which I’d also mildly recommend.
three spaceships
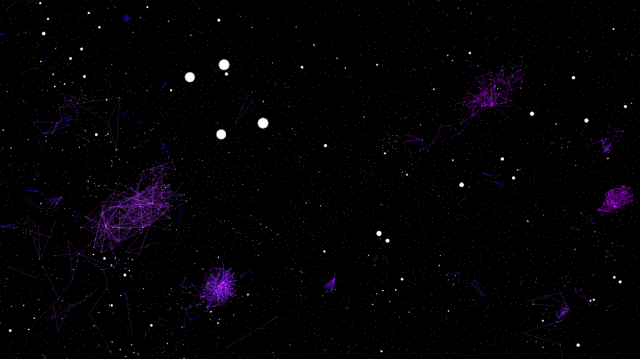
Past Sourcerer Anvaka has updated his fantastic spaceship app originally mentioned all the way back in source/target #2. Fly through a galaxy of NPM code repositories.
Protip: press space to enter steering mode and drag the mouse for the best experience. Add in a bit of Shift key action to enter warp speed.
two networks mapped
“A map of my School’s network as ‘seen’ from my dorm room”
and animated repositories
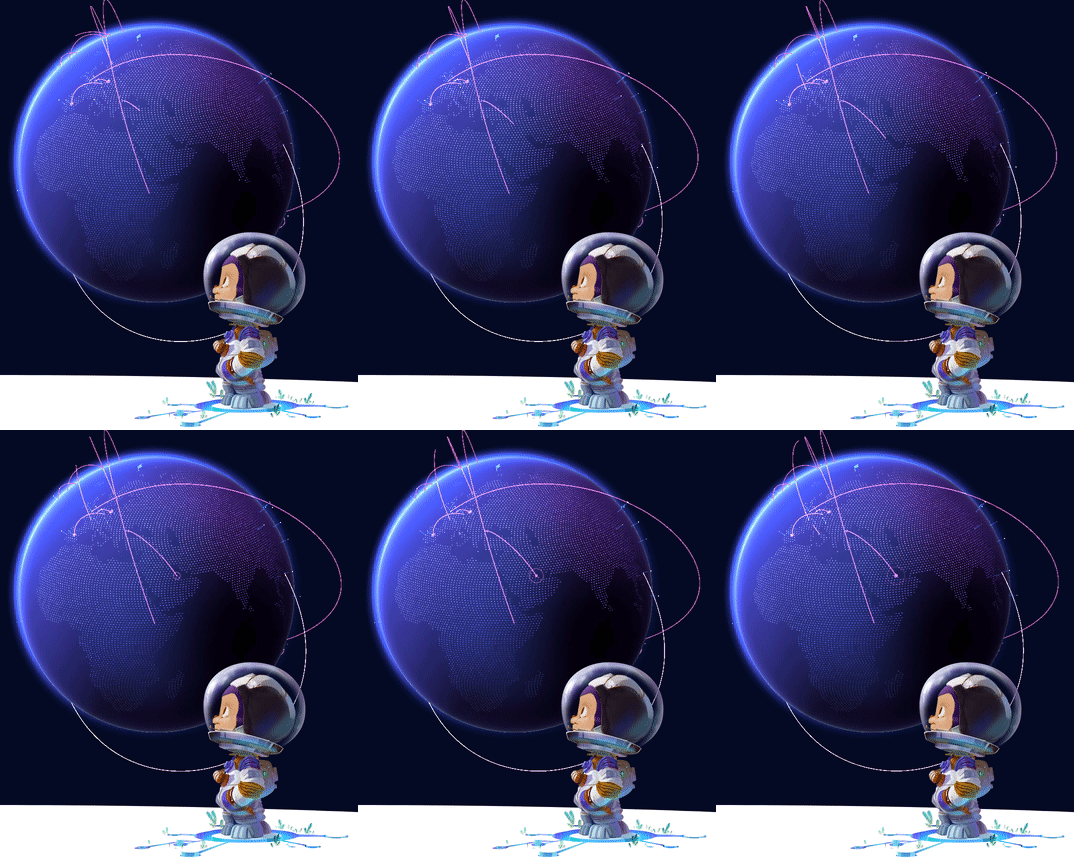
Github launched a new home page this week with a live 3D globe front and center highlighting pull requests opened and closed across the world. Hover over the links to show the source and target of each PR.
Whew! Stay safe, warm and healthy – I’ll see you all next year.
Why not share this edition with someone you think would enjoy it?
