Hi, I’m Christian and this is a newsletter with interesting content and links orbiting the world of graph.
This week I’m still looking to avoid the c-word and bring you some content to distract you, even for a little while. Please take care out there.
If you like source/target please do forward it to a friend! You can also respond directly to this email if you have any feedback, suggestions or content submissions.
Graphs
This week I’m taking a first look at a number of use-cases for applying graph thinking to the way we explore and analyze source code.
The story of left-pad is reasonably well-known at this point but for readers who aren’t familiar here’s it is in a nutshell:
Back in the heady days of 2016 a JavaScript developer unpublished a number of packages on the NodeJS package manager global repository, npm. One of the unpublished was the innocuous-sounding left-pad package consisting of 11 lines of code.
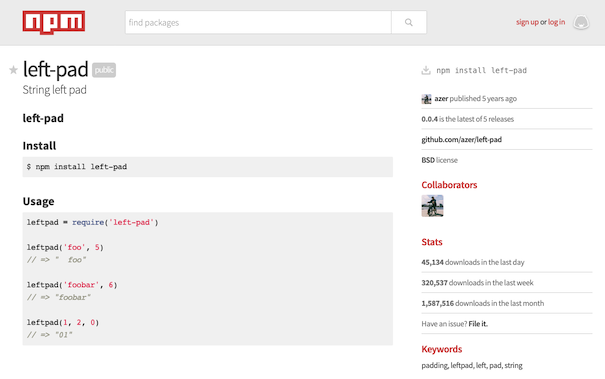
Due to the way npm worked this simple removal of 11 lines of code almost immediately had a knock on effect for applications around the world. Developers at Facebook, and elsewhere faced cryptic errors in their workspace and took to Github to report the issue. In an attempt to restore order npm were forced to “un-un-publish” the package.
It turned out thousands of applications depended on packages that, either directly or indirectly depended on left-pad. The story is a little more complex than the above, have a look here for an entertaining look at the full picture.
The issue was a stark reminder of the complex web of software dependencies that are intrinsic to modern development, especially so for the JavaScript ecosystem. While npm (recently acquired by GitHub (Microsoft)) took steps to prevent the issue from arising again it’s clear that unchecked dependencies are a liability.
It turns out it’s actually really hard to get a handle on the dependencies used by your average software repository. The five direct dependencies you may use in your React application could, in turn, import five more. It’s a classic example of exponential growth; pretty soon you’ll have either an extremely long list or, if you’re smart, a visual representation of the tree of complex dependencies you’ve pulled into your application.
This analysis and awareness is particularly important comes down to the intrinsic risk of using third party code. When it came to the missing left-pad package, there wasn’t any malicious intent for its deletion. This isn’t always the case. So far this year there have been 39 advisories released by npm to warn of packages compromised by malicious parties.
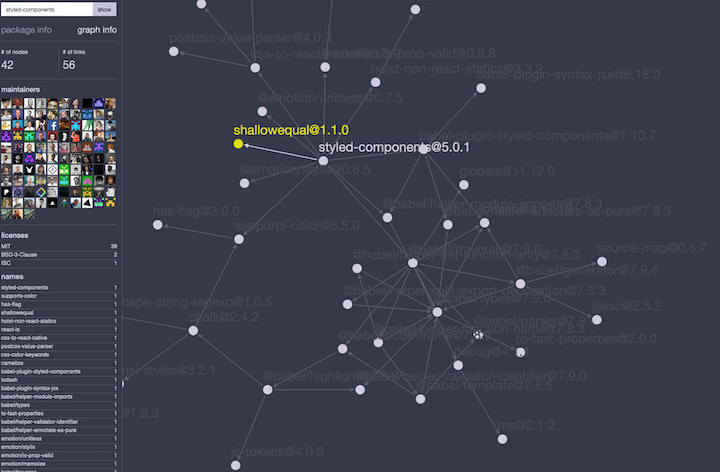
The other reason dependency analysis is important may seem a little surprising. All packages released and published in repositories like npm (should) have a license protecting the rights of the original author. These can range from permissive or restrictive depending on the intent and aims of the creator. Close to the restrictive end of the license spectrum is the GNU General Public License. GPL and some other licenses are known as copyleft which, loosely speaking, is the opposite of copyright: instead of protecting intellectual property from being distributed or copied this protects the ability to distribute or copy the software.
If GPL or similarly licensed code found its way into a closed-source commercial application, that license is seen as “viral” and means the company is obliged to release the entirety of the application that contains the GPL piece. This would be disastrous for most commercial companies as users and competitors would have access to the source code free of charge. It’s therefore imperative that large companies understand the exact licenses in use by dependencies of their applications. I recommend this article from David Marin at Toptal for a closer coverage of concerns around mixing software licenses.
Tools to analyze dependency trees have been around for a long time, a number of companies offer applications and services that successfully monitor dependencies to minimize the risk of insecure or commercially-risky code. Readers of source/target are, of course, most interested in the ones with a strong connected, visual emphasis.
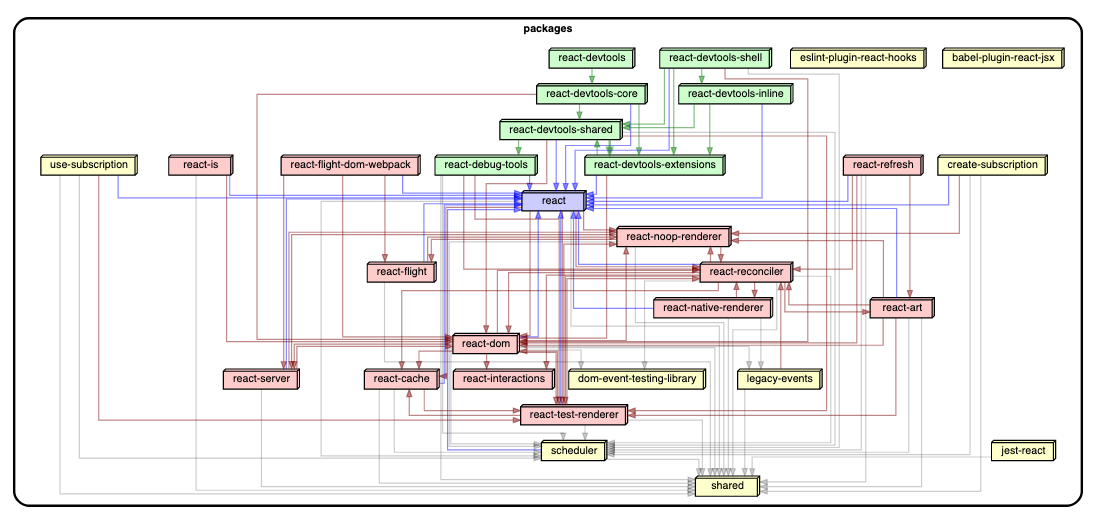
Sticking to the JavaScript ecosystem, dependency-cruiser is a neat package to analyze dependencies and enforce rules including potentially incompatible licenses. It also includes the powerful ability to export dot files that can be easily converted into extremely clean dependency graphs.
There are some great examples of these in the dependency-cruiser documentation. If you want to try it yourself Netlify has a good article walking through using dependency-cruiser for your project.
Featured back in source/target #2, Anvaka’s code galaxy is a whizzy space-inspired application that allows you to fly around a galaxy of dependencies. There’s also a 2d version linked from PikaPKG.
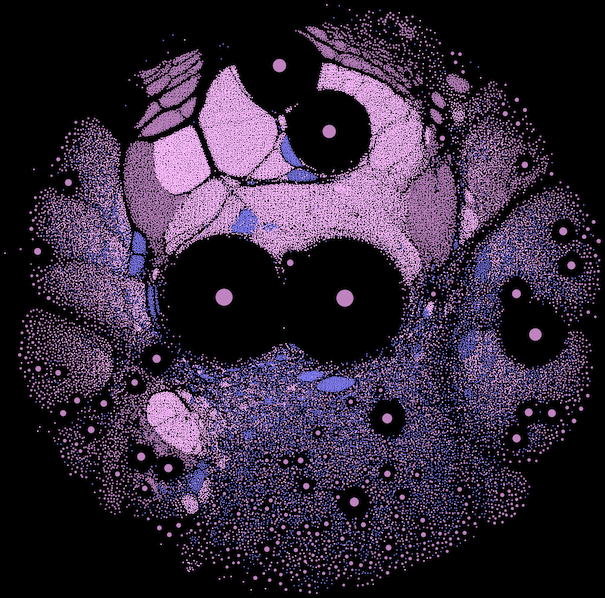
If you’re keen on rolling your own graph dependency analysis, academic stalwart Gephi is a great option. In this article from just over a year ago, Matthias Meschede walks through the process taken to build a dependency graph dependency visualization of a particularly large collection of open source software.
So far we’ve focused on dependencies between libraries but the same approach is used to explore the individual procedures, functions and calls that make up any given application. I’m going to take a closer look at some of these next time but I couldn’t resist mentioning a few below.
Nodes
I’m a recent, extremely reluctant convert to Visual Studio Code from Sublime Text. The conversion is partly due to the rich ecosystem of actively-maintained extensions available in VS Code as well as a mild case of FOMO. One such extension is GraphBuddy: an extremely slick integration that exposes an interactive graph of your Scala project. I don’t know Scala but I’m looking forward to the TypeScript support that’s in the works.
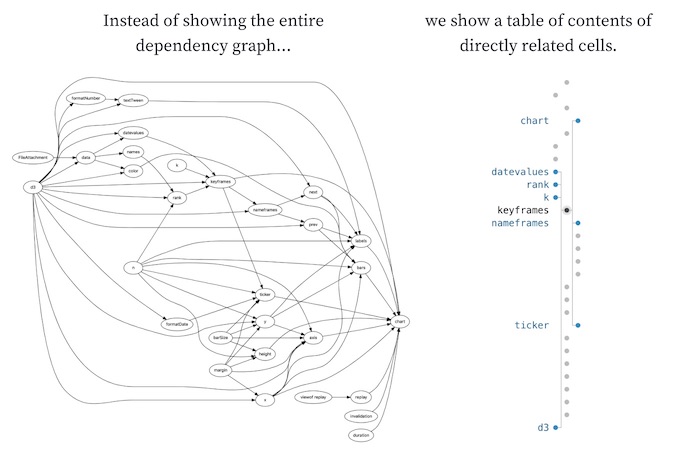
Right on cue there’s an update this week to Observable, the impressively dynamic data notebook that includes an interesting take on the “minimap” that’s all the rage in your favorite text editor. Instead of showing clumps of text it actually takes the dependencies between “cells” in your application and distills them down into a neat little widget. Check out the motivation in this illuminating Twitter thread.
Because all graph roads lead to Neo4j I have to give an honorable mention to jqAssistant which has been focusing on the efficiency, inconsistency management and rule-compliance of source code for a number of years now. As it has Neo4j on the backend it’s a very powerful approach to source code quality assurance. This is partly due to the capability to write Cypher to streamline rule creation and exception detection. Check out this podcast and transcript from Rik van Bruggen from a few years ago for a good introduction.

Finally I’m a big fan of CodeFlower. Built with d3.js it generates compact little force-directed networks giving a birds-eye view of code. Nodes are sized by the number of lines of code so it’s a nice way to spot bloat in your application.
Links
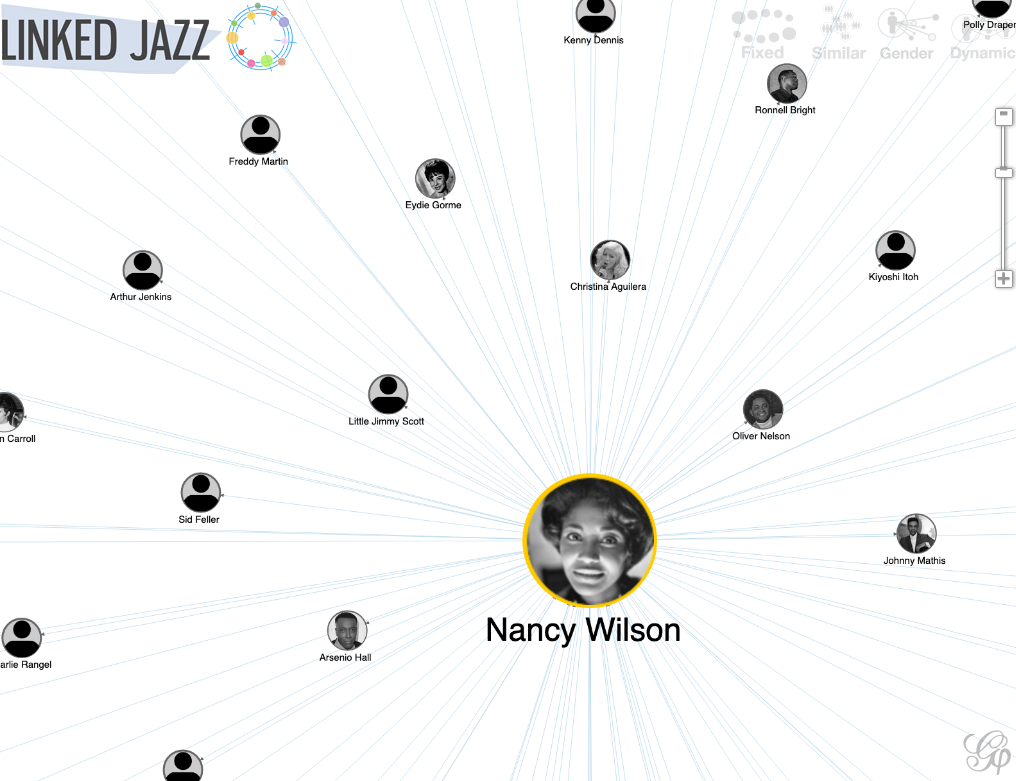
- It’s getting on a bit now but this Linked Jazz app from Semlab is a fascinating look at the connections between Jazz musicians. The graph has been generated by extracting entities from interviews so it’s a very organic look at the artists. Don’t miss the tooltips with the transcriptions, links to Wikipedia and YouTube to bring the artists to life.
Another music example is this chord diagram from On the A Side showing off the interconnectedness of Toronto artists and their records. This is a neat graph but I’d love to build something a little more comprehensive one day. So many projects so little time!
To close out the music theme I updated a blog post for work recently that uses the DBpedia knowledge graph to plot out music genres and influences in graph form. I’d love to do more work in this area in the future.
Jan Žák has posted a follow-up to his popular graph visualization walkthrough on using Pixi.JS to visualize large volumes of graph data in the browser. I’ve always been a little intimidated by the abstractions behind GPU programming but this article and accompanying code could be exactly what I needed to get started.
There have been countless Game of Thrones graph projects but this is the first Lord of The Rings one I’ve seen. It walks through the use of projection, an important tool when working with graph data. The APOC support for this in Neo4j is excellent.
Finally, check out this hierarchical graph todo list application doing the rounds on Hacker News. The graph approach isn’t compelling enough to tempt me away from Workflowy/Roam Research but it’s interesting nonetheless.
That’s it for now. Let me know if you have any feedback or suggestions. Otherwise I’ll see you again in two weeks.