In this week’s (very late!) source/target I’m exploring a rare, quirky attribute and transaction graph of high-value collectables.
For everyone sick of NFTs and the Blockchain, don’t worry, we’ll be jumping back into graph fundamentals next time.
Graphs
Blockchain Chicken
In 2008, 36 dairy farm owners, milk traders and purchasers were arrested for their direct connection to a compromised supply chain of milk and infant formula in China. Their cost-cutting actions had fatal consequences: six infants died and many more were hospitalized. An estimated 200,000 people were affected by the spiked milk products.
In “Blockchain Chicken Farm” author Xiaowei Wang mulls over whether this aberration in the supply chain could have been avoided through The Blockchain, a shared immutable ledger of transactions and transfers. Their conclusion:
The contamination came from farmers, driven by economic pressures. Blockchain wouldn’t have helped prevent falsification, but it would have made the milk more expensive.
As with the majority of apparent innovations in this area, I suspect this is another case of a solution looking for a problem. As per the illuminating “Blockchain, the amazing solution for almost nothing,”
Out of over 86,000 blockchain projects that had been launched, 92% had been abandoned by the end of 2017, according to consultancy firm Deloitte.
Why are they deciding to stop? Enlightened – and thus former – blockchain developer Mark van Cuijk explained: “You could also use a forklift to put a six-pack of beer on your kitchen counter. But it’s just not very efficient.”
No Fanks, Tokens
The main character in the NFT story is the blockchain graph of transactions. This graph is fueled by network effects leading to a surge in token “value.”
Due to the terminology and the complex “mathematical puzzles” that support their apparent magic, the blockchain and NFTs are opaque and have a firm barrier to entry. Platforms like Zora and Open Sea make the process of minting and speculating easier. Their process may be built on “proof-of-work” but there’s no work required on the part of the user. So while the barrier is diminished, the understanding still eludes.
These platforms are simply sweeping the details away—I learnt little about the minting process from using their arcane command-line APIs and web interfaces.
This combination of a general lack of knowledge and increasing options for accessing the blockchain has led to a tidal wave of get-rich-quick enthusiasts. Innovators, entrepreneurs and multi-level marketers crowd these new channels, trying to push their coin.
In most cases, and for most consumers, the blockchain is indistinguishable from a proprietary database held by a private entity. Xiaowei Wang has more to say on this:
Under governance by blockchain, records are tamperproof, but the technical systems are legible only to a select few. Even exploring transactions on a blockchain requires some amount of technical knowledge and access.
The technology of record-keeping has become increasingly more complex. This complexity requires trust and faith in the code—and trust in those who write it. For those of us who don’t understand the code, trusting a record written in natural language on a piece of paper seems at the very least a lot clearer.
Sure, I could entrust my transactions to the globally-warming server farms humming along in a bid for the utopia of a decentralized currency. But tales of loss, social engineering and volatility can make traditional banking look safe in comparison.
CryptoPunks, the O.G. N.F.T.
Let’s see how to apply graph thinking to better understand NFTs. I introduced CryptoPunks last week: the pixelated characters often thought of as the original NFT.
These unique, collectable characters were initially released for free to anyone with an Ethereum wallet.The punks themselves are diminutive pixelated characters that now fetch tens of thousands of dollars. CryptoPunk #6965 was sold last month for 800 ETH – that’s around 1,500,000 USD.
I’m going to explore these pixelated pals through three distinct graph models.
Accessories: “Nice Earring!”
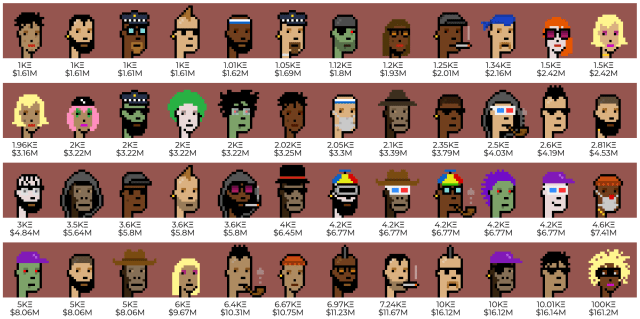
Playing heavily on the collectibility of the tokens, each punk has between zero and seven accessories and can be of one of nine types.
Attributes range from the rare “Alien” (fewer than 0.1% of punks) to the common “Male” (just over 60% of them). The most common accessory is the earring: nearly 25% of punks have an earring.
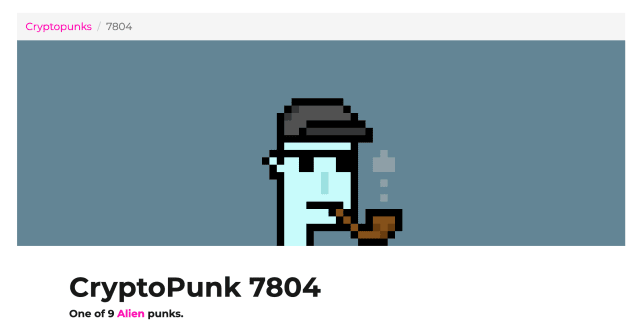
The record-breaking sale I mentioned last time has since been eclipsed by the purchase of the only existing Alien with a pipe, #7804:
The punk characteristics were originally randomly generated – building a network graph of all 10,000 punks connected to the accessories they hold, we get an extremely dense, mostly-connected view.
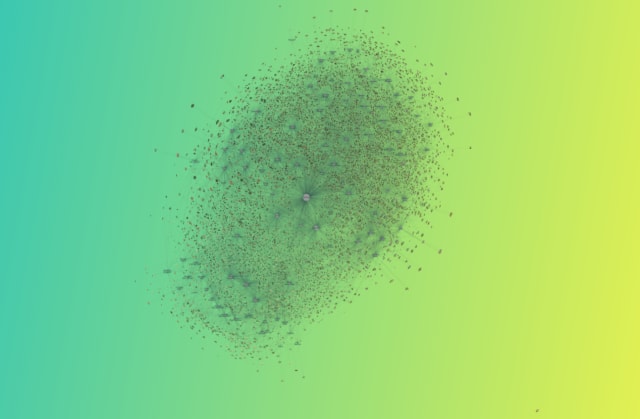
Look closely and you’ll spot there are two connected components, 9997 punks with characteristics and 4 without any characteristics at all:
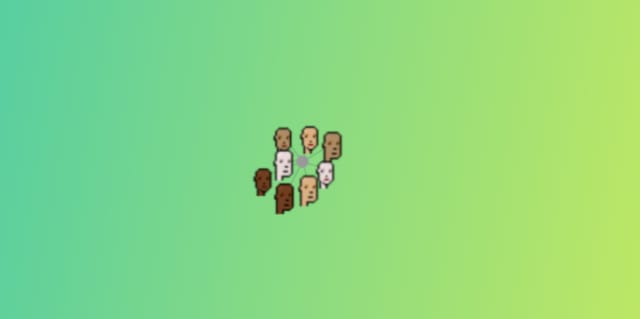
I don’t get much from this visualization although it’s fun to zoom and pan around the interactive version. We get a clearer perspective when removing the links:
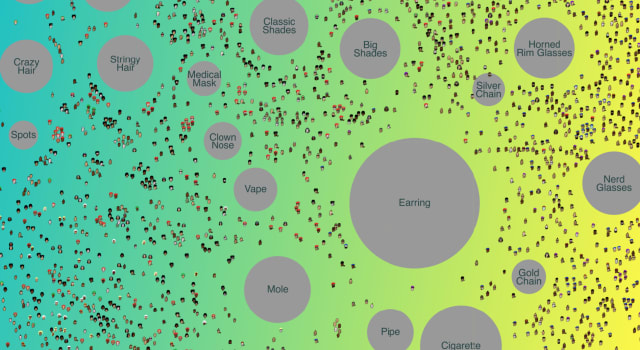
As usual when working with densely-connected data, this large graph provides us a helpful place for an initial look but is really best-suited as a springboard to dive deeper.
Transactions: Pixel Purchase
An alternative network take on the CyberPunk story is a transaction graph showing each token since their inception. The majority of these transactions are sales or transfers of the tokens from one ETH wallet to another. A lot of the transaction graphs look like this one:
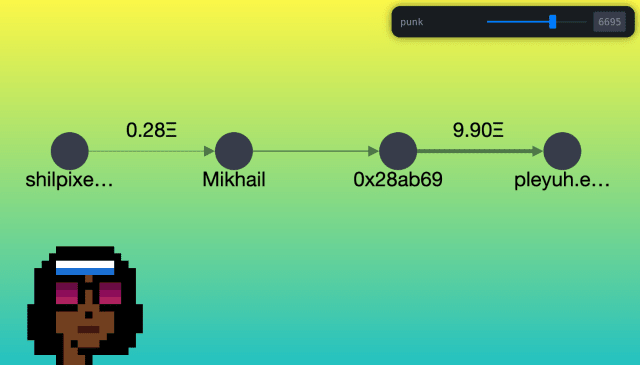
These little graphs confirm the explosion in the punks’ value. It’s not unusual to see a fat link at the far right of the network corresponding with the incredible prices fetched for the punks on the ‘chain. In the example above, the original sale was for .28 ETH – $72 back in 2017 – before being sold for 9.90 ETH earlier this year – now worth roughly $18,000. That’s almost 250 times the value!
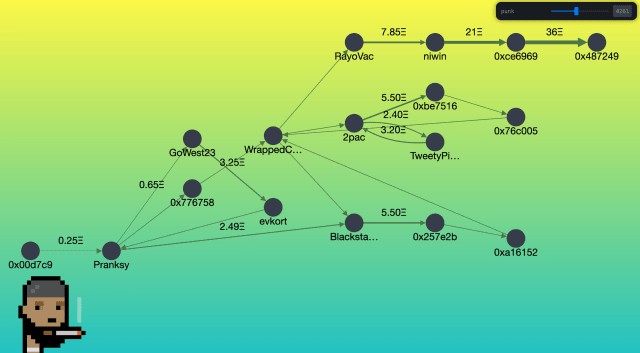
Scrubbing through the networks for each punk the first thing I notice is that the vast majority of punks have very few associated events. The raw data corresponds with this: by my calculation fewer than half of the punks have only ever been transferred once.
These links aren’t just transactions: some are alternative events in the history of each punk. I was dimly aware of “wrapping” in the crypto world. In the context of CryptoPunks, this means the use of an alternative currency to trade the NFTs.
When a Punk is wrapped our tree-like graphs get a little more complicated. The “wrapped” node in the following example is a sort of circular diversion, a gateway to an alternative blockchain. Without weighting the links by points in time my graph layout doesn’t handle this diversion very well.
Accounts: Wallet Watch
Ethereum is pseudo-anonymous, which means that it’s totally possible that multiple wallets with unique IDs or accounts could be controlled by one individual. The matching of wallets to individuals isn’t an exact science, but our graphs start to show patterns on closer inspection.
Let’s remix our data one last time to show interactions between punks and wallets – this is a mix of the two approaches we’ve explored thus far. Here’s one example account along with the CryptoPunks purchased or sold:
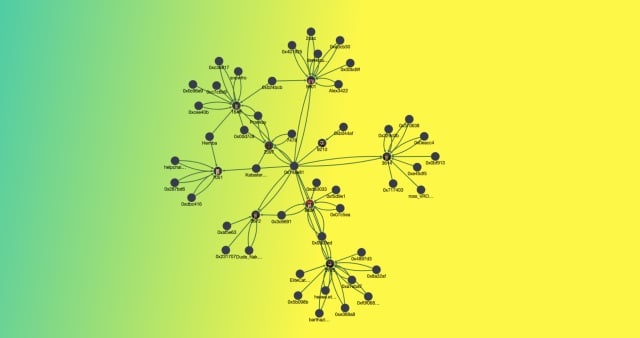
I’ve only explored two “hops” (account to punk to account) to give a flavor of the connectivity here. Most account graphs are very dense which highlight the “gotta catch ‘em all” collectible tendency for CryptoPunkFans.
I’m scratching the surface of exploration, there are many further avenues of investigation:
- Are items of value all converging towards a few wallets that hold the majority of CryptoPunks?
- What patterns are there in punk preferences?
- Have the popularity of certain punk types grown or wavered?
- What are some interesting account behaviors we can identify through social network analysis techniques?
Through a chain, dimly
Suddenly, what was opaque and intangible comes into focus. We have the inherently collectable, rarity of attributes that make it likely that someone will get attached to a punk. We can trace the type and accessory combinations that have resulted in higher value over time. Finally we gain a greater understanding of the usual patterns of accounts buying and selling the NFTs since 2017.
Using graph techniques to interpret and visualize the blockchain makes the actual NFT transactions much more transparent. This is ironic when you consider the decentralized and semi-anonymous nature of the blockchain – partially driven by the aims of untraceable cash. When we look at this in contrast to the traditional art world, notoriously rife with fraud and money-laundering, the inherently digital nature of NFTs may actually allow analysts to spot patterns more effectively than with physical transactions. All without standing up from their computer chair.
Links
Thanks for reading, see you again in a few weeks!